Figures & data
Table 1. Comparison of the demographic, clinical and laboratory data of the healthy control group and the CKD group.
Table 2. Comparison of demographic, clinical and laboratory data of healthy control group and patient groups according to CKD stages.
Table 3. Comparison of demographic, clinical and laboratory data of chronic kidney diseases patients with and without subclinical atherosclerosis.
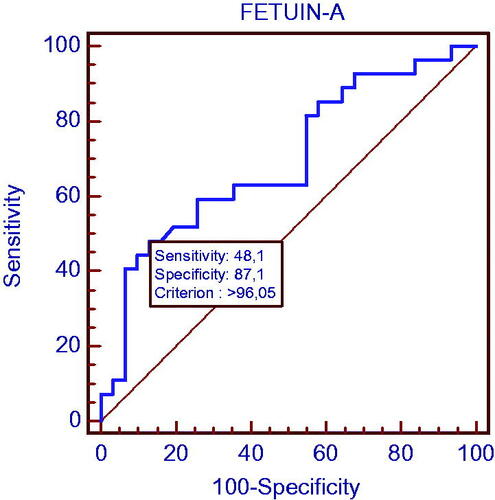
Figure 1. Relationship between CIMT and age, BMI, fetuin-A and OPG.
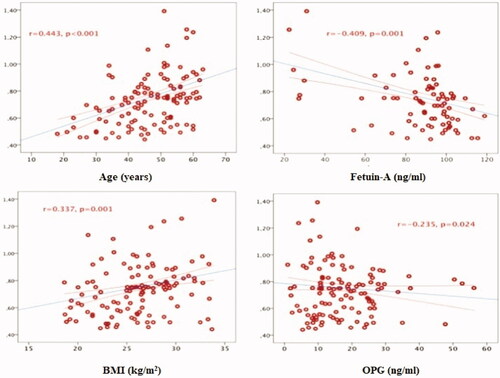
Table 4. Evaluation of multiple relationships between carotid artery intima-media thickness and other values in patients with chronic kidney disease.
Table 5. Evaluation of multiple relationships between fetuin-A, osteoprotegerin and matrix GLA protein and other data in patients with chronic kidney disease.
Table 6. Evaluation of the independent determinants of the increase in CIMT.
Figure 2. Evaluation of the power of fetuin-A level to determine the presence of subclinical atherosclerosis in the CKD group.