
Figures & data
Table 1. General characteristics of the study HD participants.
Figure 1. Scatter plot shows red blood cell (RBC) survival in days in hemodialysis (HD) patients treated with rhuEPO or roxadustat, and controls. Group median values are represented by a full red horizontal line. For comparison RBC lifespan among the three groups, Kruskal–Wallis test was used with Bonferroni correction for multiple comparisons. *p < .05, ***p < .001, and **** p < .0001.
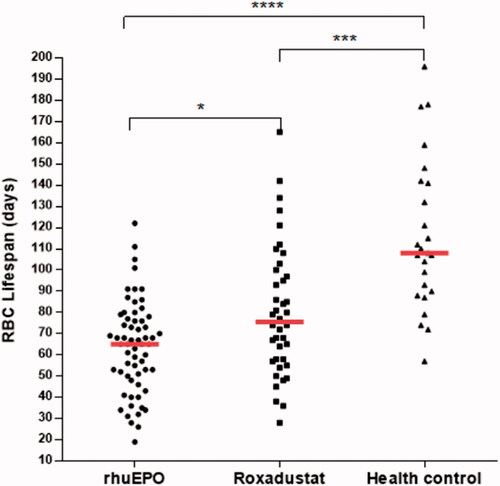
Figure 2. Relationship between RBC lifespan and hemoglobin (Hb). A significant positive correlation was observed between the RBC lifespan and Hb levels in 102 hemodialysis patients in a univariate linear correlation analysis (r = 0.256, p = .009).
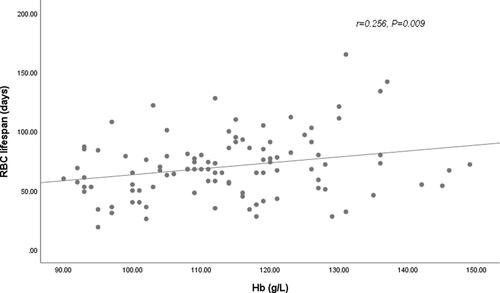
Figure 3. Relationship between RBC lifespan and serum phosphate levels. A significant positive correlation was observed between the RBC lifespan and phosphate levels in 102 hemodialysis patients in a univariate linear correlation analysis (r = 0.205, p = .046).
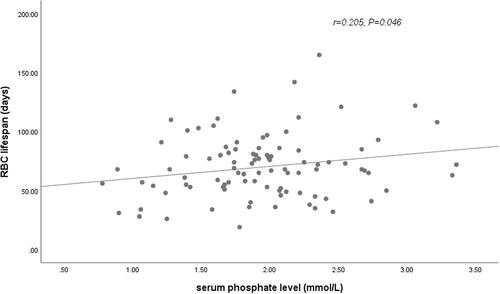
Table 2. Univariate linear regression analysis of factors affecting the RBC lifespan.
Table 3. Multiple linear regression analysis of factors affecting the RBC lifespan.