Figures & data
Figure 1. The expression of CDCA4 in Wilm’s tumor and the relationship with overall survival of patients. (a) CDCA4 transcriptional levels in Wilm’s tumor tissues (n = 6) and adjacent non-tumor tissues (n = 126) were analyzed according to the TARGET database. (b) CDCA4 mRNA level was measured in WiT49 cells and HK-2 cells by qRT-PCR analysis. p < 0.01. (c) Survival curve was plotted in high and low CDCA4 expression groups using Kaplan-Meier method (n = 121). **p < 0.01 vs. HK-2.
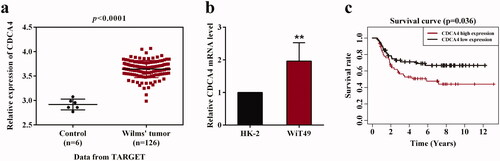
Figure 2. The influence of CDCA4-knockdown and -overexpression on the CDCA4 expression and WiT49 cells proliferation. (a–b) mRNA expression (a) and protein expression levels (b) of CDCA4 were measured by qRT-PCR (a) and western blot (b) analyses after transfected with control, si-NC, si-CDCA4-1, and si-CDCA4-2 in WiT49 cells. (c) Quantification of b. **p < 0.01 vs. control or si-NC group. (d–e) mRNA expression (d) and protein expression levels (e) of CDCA4 were examined by qRT-PCR (d) and western blot (e) analyses after transfected with control, pcDNA3.1-vector, and pcDNA3.1-CDCA4 in WiT49 cells. (f) Quantification of e. **p < 0.01 vs. control or vector group. (g–h) The influences of CDCA4-knockdown (g) and -overexpression (h) on the WiT49 cells proliferation were determined by CCK8 assay. **p < 0.01 vs. si-NC or vector group.
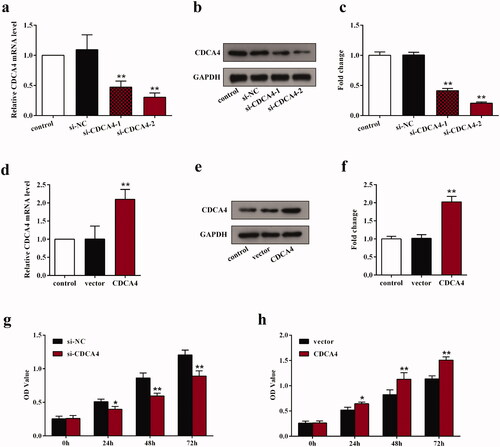
Figure 3. The influence of CDCA4-knockdown and -overexpression on the WiT49 cells apoptosis. (a) Flow cytometer with Annexin V-FITC/PI staining was conducted to evaluate the effects of CDCA4 on the cells apoptosis. (b) The sum of early and late apoptotic cells ratio (%) were calculated. **p < 0.01.
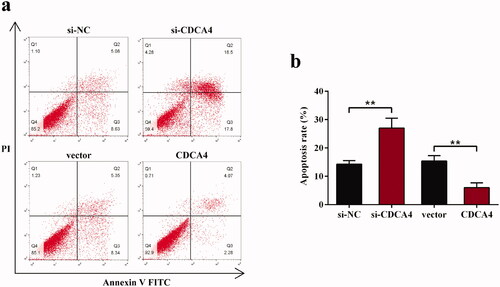
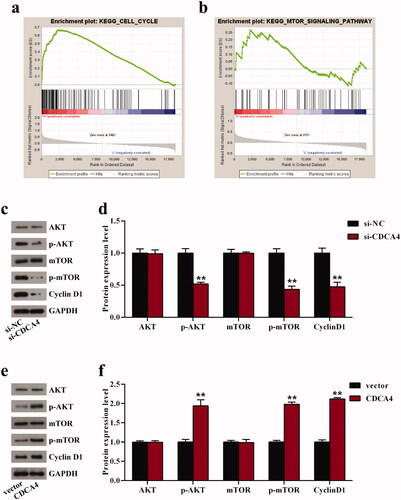
Figure 4. CDCA4 affected cell cycle and AKT/mTOR signaling pathway. (a-b) GSEA was utilized to identify the relative signaling pathway associated with high CDCA4 expression. (c-f) The effects of CDCA4-knockdown (c–d) and -overexpression (e–f) on the AKT/mTOR relative markers and Cyclin D1 protein were evaluated using western blot analysis. (d) Quantification of c. (f) Quantification of e. **p < 0.01 vs. si-NC or vector group.