
Figures & data
Table 1. Demographic and clinical characteristics of the three groups.
Figure 1. The score plots of PCA model in positive-ion mode (A, C) and negative-ion mode (B, D); A(A1) and B(B1) show health controls, ESRD patients without depression and ESRD patients with depression; C(C1) and D(D1) show ESRD patients without depression and ESRD patients with depression.
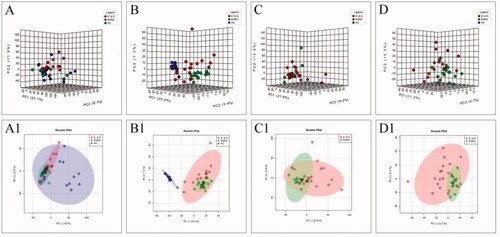
Figure 2. The score plots of PLS-DA model in positive-ion mode (A, C) and negative-ion mode (B, D); A(A1) and B(B1) show health controls, ESRD patients without depression and ESRD patients with depression; C(C1) and D(D1) show ESRD patients without depression and ESRD patients with depression.
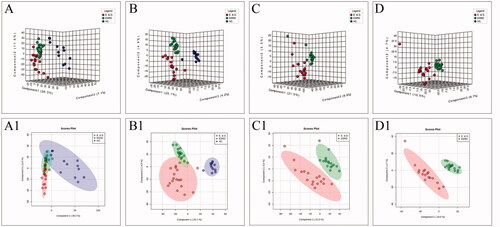
Figure 3. The score plots of the three groups of SPLS-DA model in positive-ion mode (A, C) and negative-ion mode (B, D); A(A1) and B(B1) show health controls, ESRD patients without depression and ESRD patients with depression; C(C1) and D(D1) show ESRD patients without depression and ESRD patients with depression.
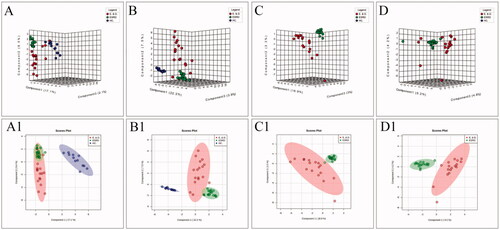
Table 2. Characteristic compounds of ESRD patients without depression vs. ESRD patients with depression.
Figure 4. Thermogram of the relative content of differential metabolites: (A) is three groups; (B) shows ESRD patients without depression and ESRD patients with depression. (C) Shows the analytical heat map of the 50 metabolite contents with the largest differences between the three groups. (D) Shows the analytical heat map of the 50 metabolite contents with the largest difference between the two groups.
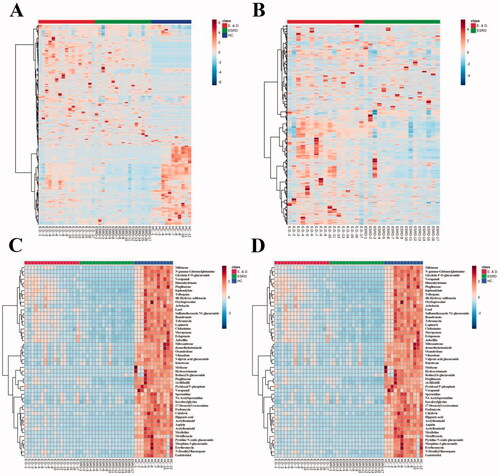
Figure 5. Scores of metabolite pathways involved by differential metabolites in ESRD patients without depression vs. ESRD patients with depression. The size and color of each circle are based on pathway impact value and p value, respectively.
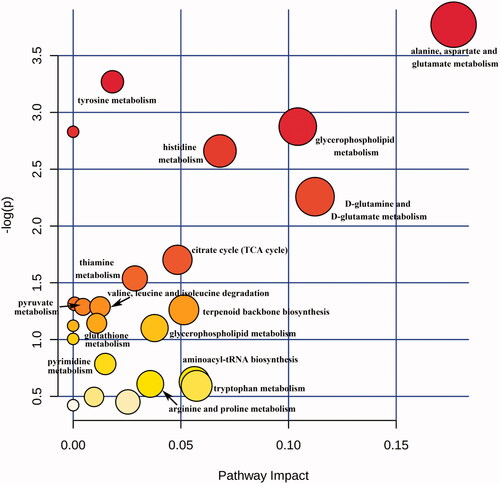
Table 3. Different metabolite pathway in ESRD patients without depression versus ESRD patients with depression.
Table 4. The metabolites for the diagnosis of ESRD with depression (AUC ≥0.90).
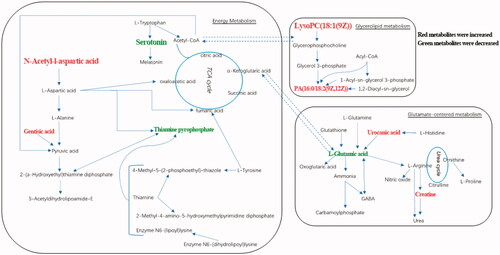
Figure 6. Biochemical transformation of differential metabolites. ESRD patients with depression compared with ESRD patients without depression, red metabolites have increased and green metabolites decreased.
Data availability statement
The study data can be accessed from the corresponding author Ran J.H. or Li J.F. by request.