Figures & data
Table 1. The patient’s laboratory test results on admission.
Figure 1. Pathology of renal biopsy. (A) Light microscopy (LM) shows cellular crescent, PAS staining × 50. (B) Large cellular crescent formation, PAS staining × 400. (C) LM showed an MPGN pattern and full of crescents, PASM staining × 50. (D) Cellular crescent formation and compressed capillary loops, PASM staining × 400. (E) Immunofluorescence shows granular IgG deposition along the capillary wall and in the mesangial area (×200). (F) Immunofluorescence shows IgG subtype is IgG3. (G) Immunofluorescence shows granular κ light chain deposition along the capillary wall and in the mesangial area (×200). (H) Immunofluorescence shows negativity for lambda light chain (×200).
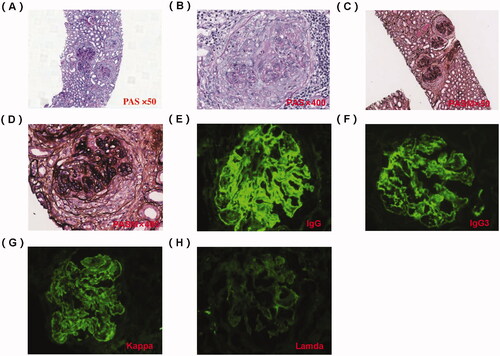
Figure 2. Electron microscope of renal biopsy specimens. (A) Electron microscope shows the electric-dense deposits in the mesangial area (×12,000). (B) Electron microscope shows the electric-dense deposits in subendothelial areas of glomeruli (×6000).
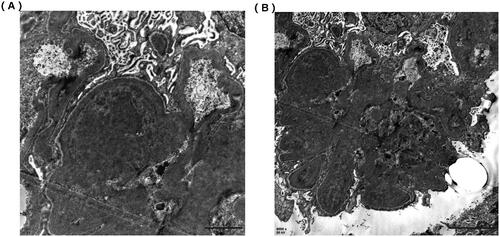
Figure 3. Bone marrow biopsy analysis. (A) Lymphocytes and plasma cells are scattered (×10). (B) There was no increase or aggregation of primitive/naive cells, lymphocytes, and plasma cells (×80).
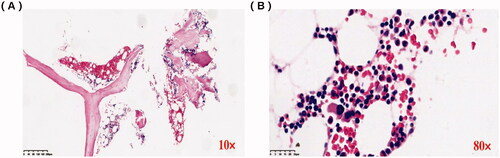
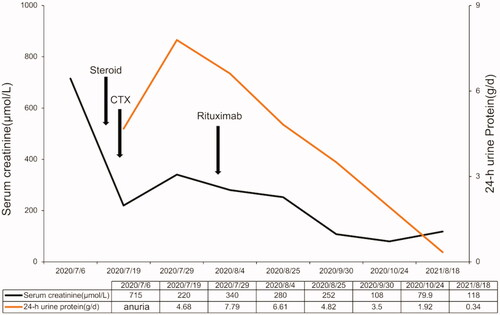
Figure 4. The patient’s treatment follow-up chart. The chart includes the time and dose of the patient’s steroid use and the timing of the use of immunosuppressants and the alterations of clinic parameters including urine protein and serum creatinine during the treatment.