
Figures & data
Figure 1. Participated patients’ flowchart. (A) Definitions of the three main groups and details of follow-up. (B) Definitions of baseline and follow-up period, and changes of VDRA usage status from the time of initiation of dialysis (baseline) to March 2015 (interim report). IV: intravenous VDRA group; OV: oral VDRA group; NV: without VDRA group.
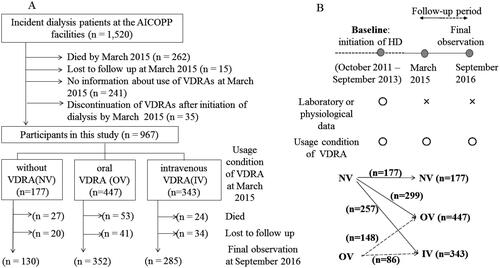
Table 1. Baseline characteristics and laboratory data before commencing dialysis.
Figure 2. Kaplan–Meier curves for the cumulative survival between the three groups. Significant differences between the cumulative survival rates were observed for the three groups (p = 0.010). IV: intravenous VDRA group; OV: oral VDRA group; NV: without VDRA group.
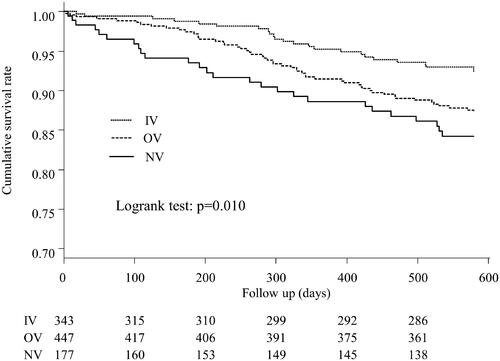
Figure 3. Kaplan–Meier curves for the cumulative survival for each cause of death between the three groups. (A) Comparison of mortality from cardiovascular diseases, (B) Comparison of mortality from infection, (C) Comparison of mortality from cancer, (D) Comparison of mortality from non-cancer causes. Significant differences between the non-cancer-related mortality were observed for the three groups (p = 0.027). IV: intravenous VDRA group; OV: oral VDRA group; NV: without VDRA group.
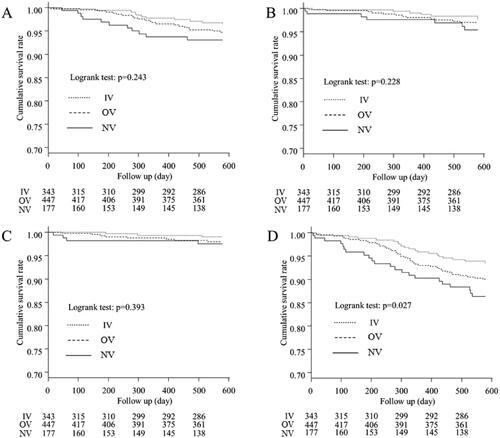
Table 2. Associations of variables with all-cause mortality according to the univariate Cox proportional hazard regression analysis.
Table 3. Associations of variables with all-cause mortality according to the multivariate Cox proportional hazard regression analysis.
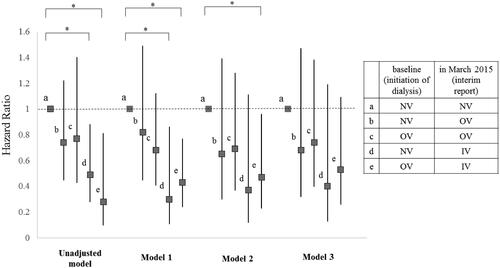
Figure 4. Hazard ratio for all-cause mortality of each subgroup compared to Subgroup 1. Subjects were subdivided into five subgroups according to which form of VDRA was used at both of two points: initiation of dialysis (at baseline) and March 2015 (at interim report). Subgroup a, which did not use VDRA at both points (NV-NV); Subgroup b, which used oral VDRA in March 2015 but not at dialysis initiation (NV-OV); Subgroup c, which used oral VDRA at both points (OV-OV); Subgroup d, which had not used any forms of VDRA at initiation of dialysis but used intravenous VDRA in March 2015 (NV-IV); and Subgroup e, which had used oral VDRA at initiation of dialysis but used intravenous VDRA in March 2015 (OV-IV). Models were adjusted by several factors as follows: Model 1: adjusted for age and gender. Model 2: adjusted for Model 1 plus comorbidity of diabetes, history of cardiovascular disease, BMI, diastolic blood pressure, aortic calcification, eGFR, serum phosphate, serum magnesium, and use of ACEI / ARB. Model 3: adjusted for Model 2 plus serum adjusted calcium. All-cause mortality rates were significantly lower of the Subgroup d than the Subgroup a in model 1 (HR = 0.30, 95% CI = 0.11–0.86, p = 0.024). All-cause mortality rates were significantly lower for the Subgroup e than the Subgroup a in model 1 and 2 (HR = 0.43, 95% CI = 0.24–0.77, p = 0.004, HR = 0.47, 95% CI = 0.23–0.96, p = 0.038, respectively). Details of hazard ratio (CI) and P value of each subgroup in each model were as follows. Significant p values are marked with * in the figure. In unadjusted model, b (HR = 0.74, 95% CI = 0.45–1.22, p = 0.240); c (HR = 0.77, 95% CI = 0.43–1.40, p = 0.396); d (HR = 0.49, 95% CI = 0.28–0.88, p = 0.016); e (HR = 0.28, 95% CI = 0.099–0.81, p = 0.019). In Model 1, b (HR = 0.82, 95% CI = 0.45–1.49, p = 0.520); c (HR = 0.68, 95% CI = 0.41–1.12, p = 0.127); d (HR = 0.30, 95% CI = 0.105–0.856, p = 0.024); e (HR = 0.43, 95% CI = 0.24–0.768, p = 0.004). In Model 2, b (HR = 0.65, 95% CI = 0.30–1.39, p = 0.265); c (HR = 0.69, 95% CI = 0.37–1.28, p = 0.241); d (HR = 0.37, 95% CI = 0.12–1.105, p = 0.075); e (HR = 0.47, 95% CI = 0.23–0.958, p = 0.038). In Model 3, b (HR = 0.68, 95% CI = 0.32–1.47, p = 0.332); c (HR = 0.74, 95% CI = 0.40–1.38, p = 0.337); d (HR = 0.40, 95% CI = 0.13–1.19, p = 0.098); e (HR = 0.53, 95% CI = 0.26–1.09, p = 0.083). IV: intravenous VDRA group; OV: oral VDRA group; NV: without VDRA group.
Supplementary Material
Download PDF (279.2 KB)Data availability statement
The datasets analyzed during the current study are available from the corresponding author on reasonable request.