
Figures & data
Figure 1. Enrollment and outcomes of the cohort.
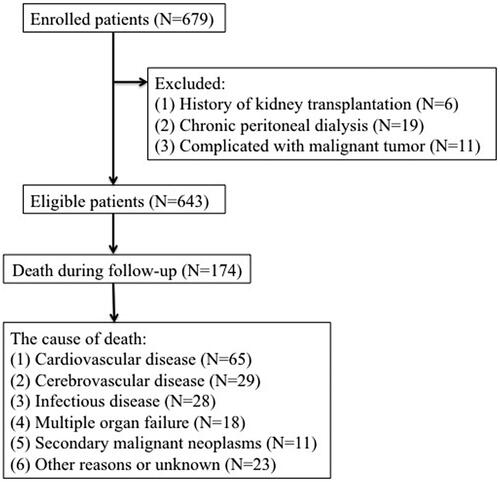
Table 1. Baseline characteristics of the study populations and subpopulations.
Table 2. The comparison of clinical characteristics in the dead and the living patients.
Figure 2. Nomogram to predict risk of all-cause mortality in HD patients.
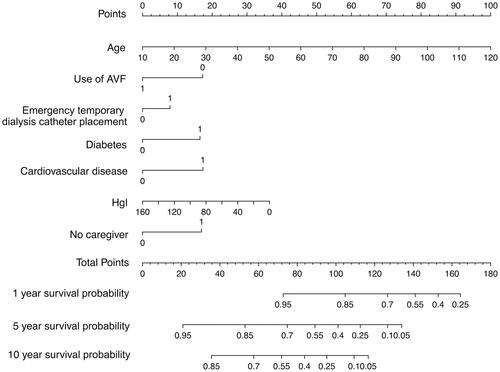
Table 3. Multivariable hazard ratios for the relationship between prognostic risk factors and 10-, 5-, and 1-year all-cause mortality.
Figure 3. AUC of training cohort was 0.779.
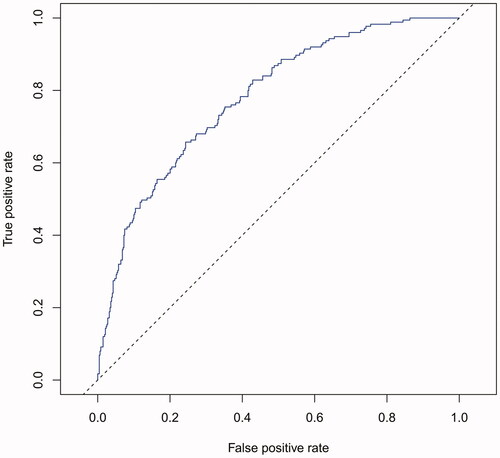
Figure 4. AUC of validation cohort was 0.758.
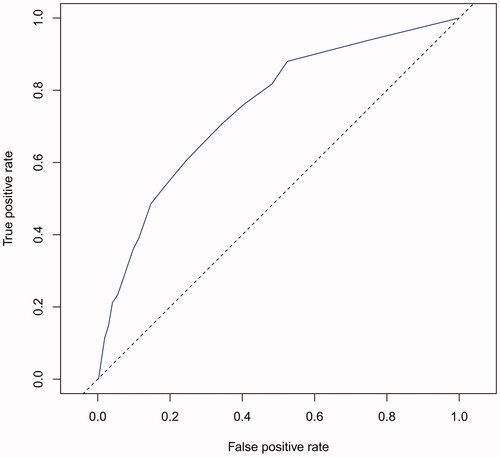
Figure 5. Calibration plots for predicting probability of all-cause mortality. A 45° diagonal line indicates perfect calibration. Calibration plot of training cohort.
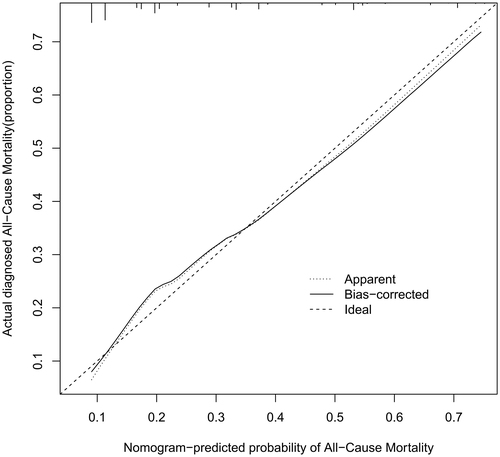
Figure 6. Calibration plots for predicting probability of all-cause mortality. A 45° diagonal line indicates perfect calibration. Calibration plot of validation cohort.
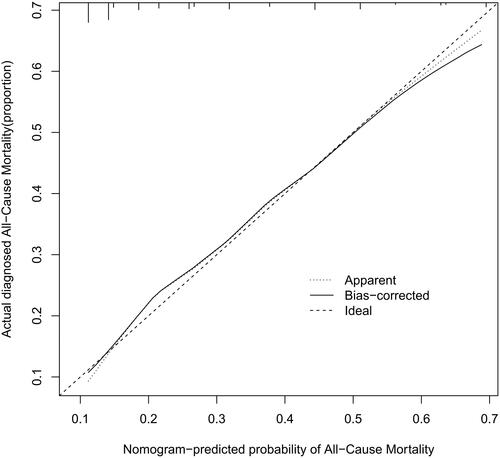
Figure 7. Kaplan–Meier’s survival curves in the training cohort on the basis of the nomogram.
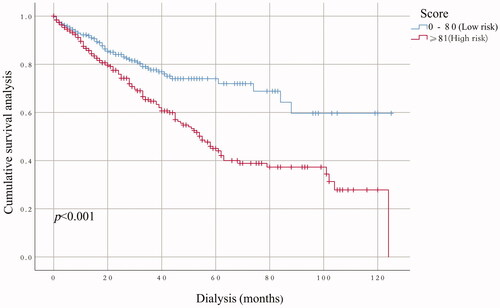
Figure 8. Kaplan–Meier’s survival curves in the validation cohort on the basis of the nomogram.
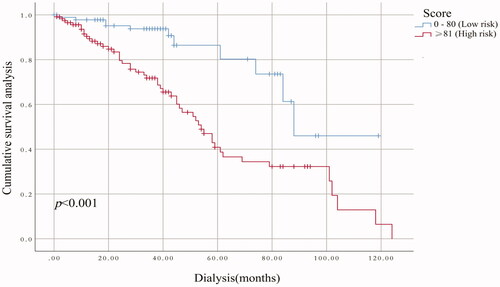
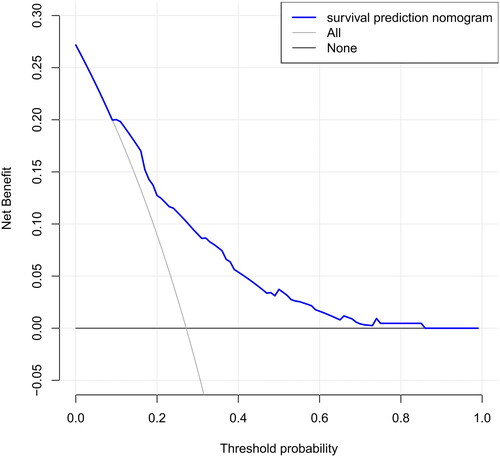
Figure 9. Decision curve analysis for the survival nomogram.
Data availability statement
The data used in this study are available from the corresponding author upon request.