
Figures & data
Table 1. Comparison of clinical characteristics in accordance with serum FABP4 level.
Table 2. Comparison of clinical characteristics among PD patients with an AAC score <4 or ≥4.
Figure 1. Correlations between serum FABP4, AAC score, and other clinical parameters.
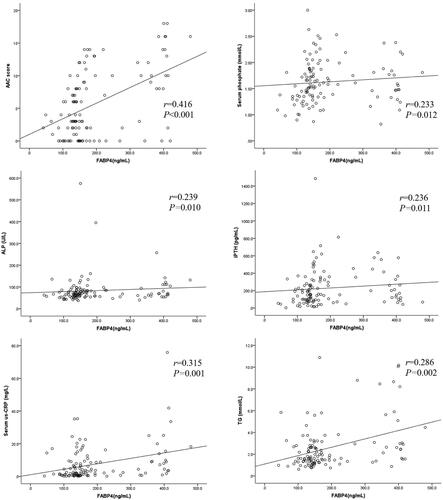
Table 3. Correlations between the AAC score, serum FABP4 level, and other parameters.
Table 4. Univariate and multivariate linear regression analysis for the AAC score.
Table 5. Independent factors associated with an AAC score ≥4 by logistic regression analysis.
Data availability statement
The data underlying this article will be shared upon reasonable request to the corresponding author.