Figures & data
Figure 1. ISL attenuated pathological injury of murine kidney and renal dysfunction in the LPS-induced mouse model. LPS induce AKI mice models were developed by intraperitoneal (i.p.) LPS injection. A total of 30 mice were randomly divided into six groups (n = 5): control, ISL, Fer, LPS, LPS plus ISL, and LPS plus Fer. An intraperitoneal injection of LPS (10 mg/kg) was made to induce septic AKI. ISL was administered via gavage at 50 mg/kg 30 min before LPS injection. (A) H&E and PAS staining. (B) Damage score of renal tubular injury. (C) Murine renal function detection about SCr and BUN. ‘*’means compared with the LPS group and p < 0.05. ‘**’means compared with the LPS group and p < 0.01.
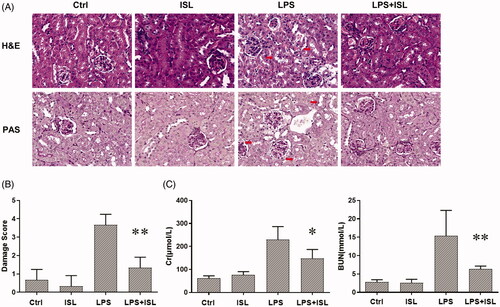
Figure 2. Measurement of MDA and nitric oxide after ISL treatment upon LPS induction. LPS induce AKI mice models were developed by intraperitoneal (i.p.) LPS injection. A total of 30 mice were randomly divided into six groups (n = 5): control, ISL, Fer, LPS, LPS plus ISL, and LPS plus Fer. An intraperitoneal injection of LPS (10 mg/kg) was made to induce septic AKI. ISL was administered via gavage at 50 mg/kg 30 min before LPS injection. HK2 cells were treated with 50 μM or 100 μM ISL for 5 h, before septic AKI was induced using 2 μg/mL LPS. Cells were collected 24 h after LPS inducing. And the cell experiments were repeated at three times. (A) MDA measurement of mice kidney tissue homogenate. (B) MDA measurement of HK2 cell homogenate. (C) Nitric Oxide Assay of murine serum. (D) Nitric Oxide Assay of HK2 cell supernatant. ‘*’ means compared with the LPS group and p < 0.05. ‘**’ means compared with the LPS group and p < 0.01. ‘***’ means compared with the LPS group and p < 0.001. ‘#’ means compared with the control group and p < 0.05. ‘##’ means compared with the control group and p < 0.01. ‘###’ means compared with the control group and p < 0.001.
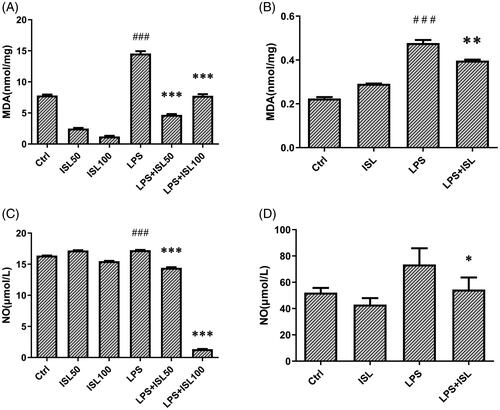
Figure 3. ISL inhibited Fe2+ and lipid peroxidation accumulation in LPS-stimulated cells. HK2 cells were treated with 50 μM or 100 μM ISL for 5 h, before septic AKI was induced using 2 μg/mL LPS. Cells were collected 24 h after LPS induction. FerroOrange was used as fluorescent probe to measure the level of Fe2+ in HK2 cells. Liperfluo was employed to detect the level of lipid peroxidation in HK2 cells. Mito-Ferrogreen could further detect Fe2+ ions in the mitochondria of HK2 cells. Magnification: ×60 oil.
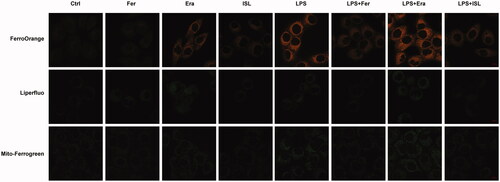
Figure 4. ISL increased the expression of GPX4 and xCT then attenuated mitochondria injury in renal tubular following LPS injection in mice. A total of 30 mice were randomly divided into six groups (n = 5): control, ISL, Fer, LPS, LPS plus ISL, and LPS plus Fer. An intraperitoneal injection of LPS (10 mg/kg) was made to induce septic AKI. ISL was administered via gavage at 50 mg/kg 30 min before LPS injection. Immunohistochemical staining in mice to detect GPX4 and xCT. And mitochondria analysis with scanning electron microscope. Magnification for immunohistochemical staining: ×400.
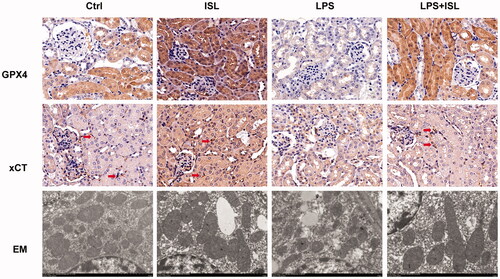
Figure 5. Ferrostatin-1 protected mice against renal dysfunction and renal tubular damage in LPS-induced AKI. Mice were administered a single dose of either 50 mg/kg ISL orally or 5 mg/kg ferroptosis inhibitor ferrostatin-1 intraperitoneally before 10 mg/kg LPS injection. (A) The level of SCr and BUN in mice. (B) The results of H&E and PAS staining. (C) Immunohistochemical staining with GPX4 and xCT in mice kidney. Magnification: ×400. ‘*’ means compared with the LPS group and p < 0.05.
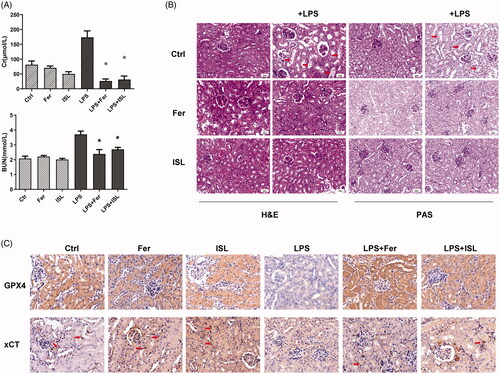
Figure 6. ISL inhibited the expression of HMGB1 and increased the expression of GPX4 both in vivo and in vitro following LPS stimulation. (A) Western blot assay about HMGB1 and GPX4 in murine kidney tissues. (B) Western blot assay about HMGB1 and GPX4 in HK2 cells.
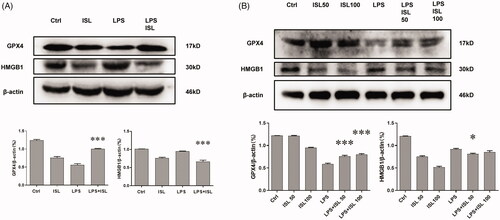
Figure 7. ISL reduced the expression of NOCA4 both in vivo and in vitro upon LPS induction (A) Western blot assay about NCOA4 in murine kidney tissues. (B) Western blot assay about NCOA4 in HK2 cells. (C) Immunohistochemical staining with NCOA4 in mice kidney tissues. Magnification for immunohistochemical staining: ×400.
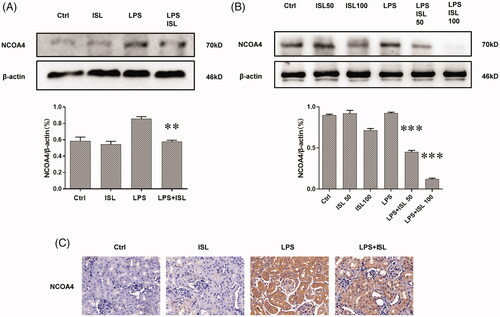
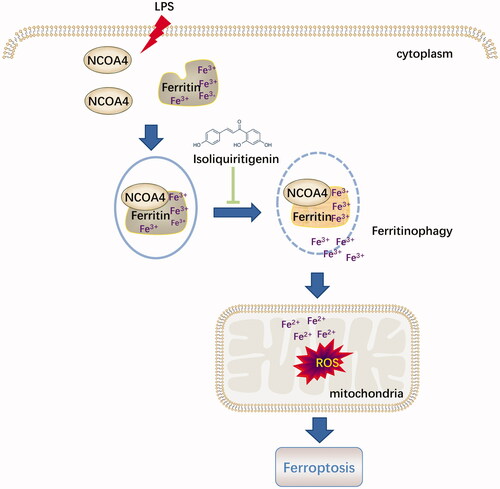
Figure 8. Diagram illustrated that the potential role of ISL against ferritinophagy-mediated ferroptosis in renal tubular following LPS stimulation.