
Figures & data
Figure 1. Flow chart including patient enrollment and outcomes.
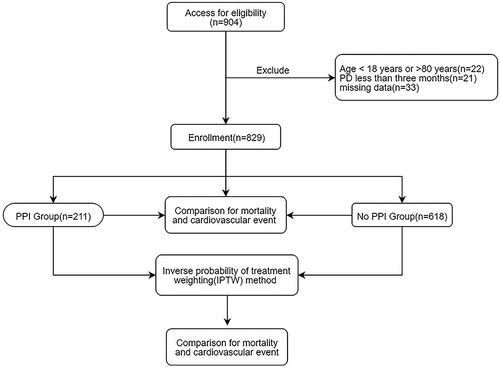
Table 1. Patient demographic and clinical characteristics.
Table 2. Significant risk factors for all-cause mortality and CV events.
Figure 2. Cumulative incidence curves for mortality and CV events by category of the use of PPI. (A) Cumulative incidence curves for all-cause mortality. (B) Cumulative incidence curves for the incidence of CV events. The curves were constructed using the Kaplan–Meier method and compared using the Mantel–Cox log-rank test.
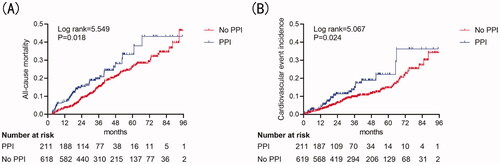
Figure 3. Cumulative incidence curves for mortality and CV events by category of the usage of PPI after IPTW. (A) Cumulative incidence curves for all-cause survival. (B) Cumulative incidence curves for the incidence of CV events. The curves were constructed using the Kaplan–Meier method and compared using the Mantel–Cox log-rank test.
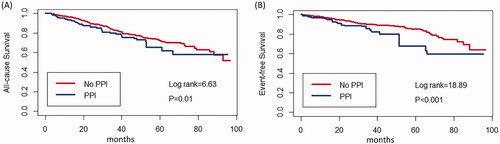
Table 3. Relationship between PPI and the adverse prognosis.