Figures & data
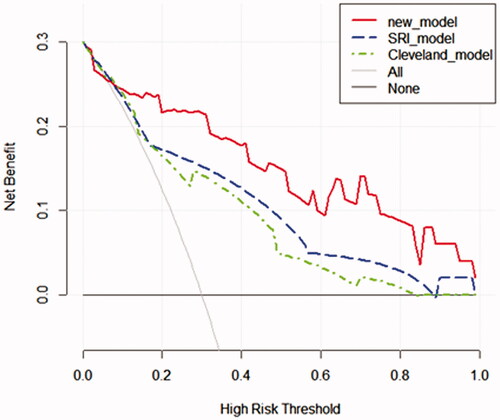
Figure 1. Flowchart of participant selection.
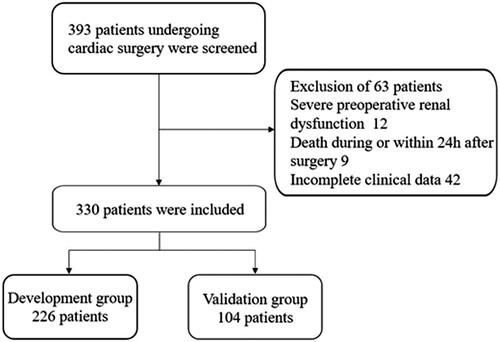
Table 1. Baseline characteristics of development and validation group.
Figure 2. Least absolute shrinkage and selection operator (LASSO) binary logistic regression analysis in prediction of RRT. (A) The optimal parameter (λ) of Lasso is selected by the minimum criterion for five times cross-validation. The dotted vertical lines were plotted at the optimal values using the minimum criteria and the one standard error of the minimum criteria (the 1 − SE criteria). Finally, the λ value of 0.0191 was selected. (B) The distribution of the lasso coefficient of fifty-five variables. A coefficient profile plot was produced against the log (λ) sequence. Predictors were selected based on the minimum criteria, where the best λ produced fourteen predictors with non-zero coefficients.
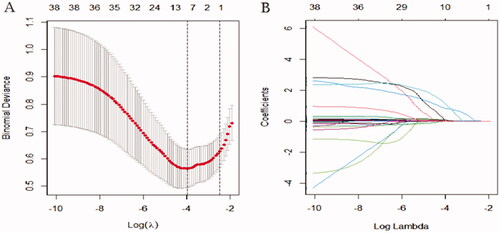
Table 2. Multivariate logistic regression analyses of variables selected with LASSO.
Figure 3. Prediction of RRT in renal insufficiency patients after cardiac surgery by nomogram model. In order to get every factor’s position on the corresponding axis, lines were drawn on the point axis to represent the number of points. Added all points, find the position of the total score to determine the RRT probability of that line in the nomogram. Cys C, preoperative cystatin C (μg/L); Cr, creatinine (μmol/L); RRT, renal replacement therapy.
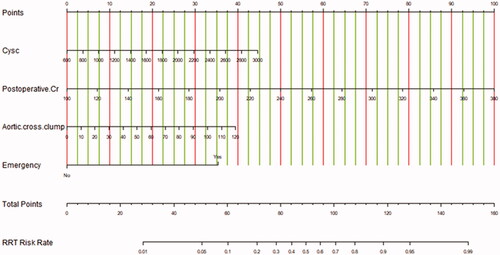
Figure 4. Calibration curves in the validation group for the new model (A), SRI score (B), and Cleveland score (C), respectively. The predicted RRT was plotted on the X-axis, and the actual RRT occurrence was plotted on the Y-axis. A plot along the 45° line would indicate a perfect calibration model in which the predicted RRT is identical to the actual RRT. The dotted line has a close fit to the solid line, which indicated better predictive accuracy of the model.
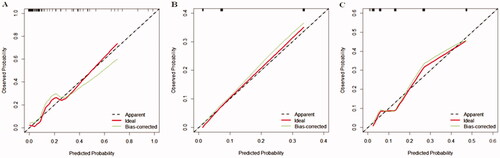
Figure 5. The AUC for models in the validation group. Comparison of AUC among models for RRT in renal inadequacy patients after cardiac surgery. New model AUC: 0.813; SRI score AUC: 0.791; Cleveland Clinic score AUC: 0.786. The new model versus SRI score, P = 0.809; new model versus Cleveland score, P = 0.746.
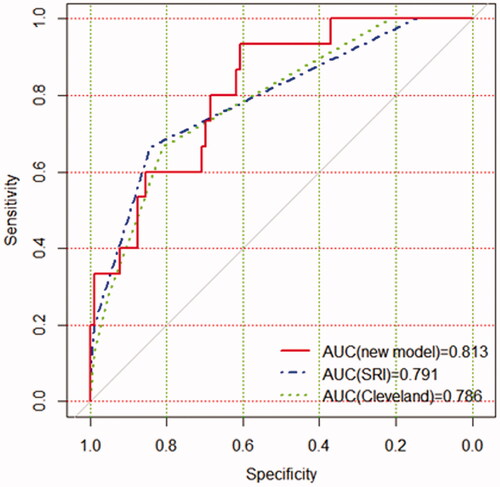
Figure 6. Decision curve analyses for prediction models. The x‐axis shows the threshold probability. The y‐axis shows the net benefit. The black solid lines hypothesized that all patients were RRT positive or negative, respectively. Across the range of decision thresholds, the new model was positive and had a larger net benefit than the SRI and Cleveland scores.