
Figures & data
Figure 1. Enrollment flow chart of this study. PD: Peritoneal dialysis; PSQI: Pittsburgh Sleep Quality Index.
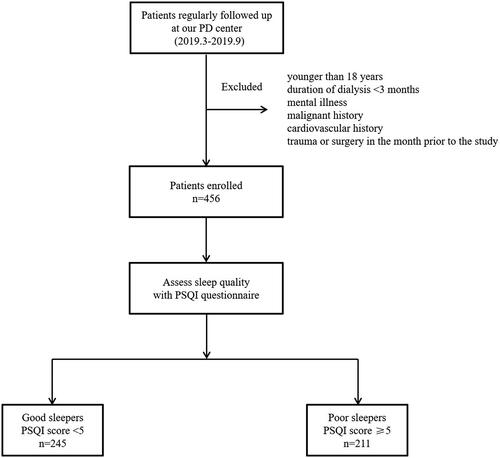
Table 1. Comparison of demographic and laboratory data between good sleepers and poor sleepers.
Table 2. Risk factors related to poor sleep quality in patients undergoing CAPD: univariate logistic and multivariate logistic regression analysis.
Data availability statement
Raw data were generated at the First Affiliated Hospital of Nanchang University, China. The derived data supporting the findings of this study are available from the corresponding author, YM, upon request.