Figures & data
Table 1. Baseline characteristics stratified by DKD occurrence in enrolled T2DM patients.
Figure 1. Receiver operating characteristic (ROC) curve for DKD predictive models based on multivariate logistic regression analysis. (A) ROC curve for model 1 showed that its AUC for predicting DKD was 0.8943. Its optimal cutoff value was 0.26, with a specificity and sensitivity of 0.764 and 0.852, respectively. (B) ROC curve for model 2 showed that its AUC for predicting DKD was 0.8946. Its optimal cutoff value was 0.22, with a specificity and sensitivity of 0.797 and 0.818, respectively.
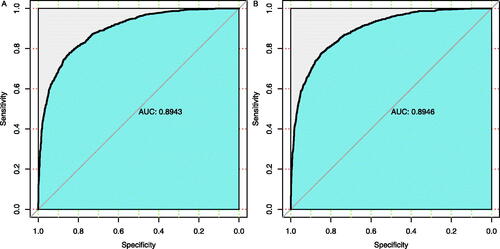
Table 2. Prediction models for DKD by the forward selection method (Model 1) and the backward elimination method (Model 2).
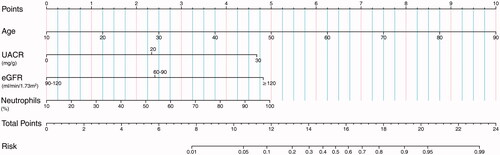
Figure 2. Nomograms to predict the 3-year risk of diabetic kidney disease (DKD) in Chinese patients with type 2 diabetes (T2DM). Note: The renal nomogram was developed in the cohort, with variables, age, UACR, eGFR, and neutrophils percentages. Steps to estimate the DKD risk: first, obtain the point for each variable by drawing a vertical line from the value to the scoring ruler; second, summate points for all variables to calculate a total point; finally, evaluate the risk of DKD onset by drawing a vertical line from the total points to the predicted risk ruler. Abbreviations: UACR, urinary albumin to creatinine ratio; eGFR, estimated glomerular filtration rate.