
Figures & data
Figure 1. Characteristics of extracellular vesicle (EV) in subjects. 15 mL of morning urine from subjects was collected. Extracellular vesicles were extracted from urine by high-speed centrifugation (12000 × g, 30 min), ultrafiltration enrichment (100KD, 15 mL) and ExoQuick™ Exosome Precipitation Kit (EXOTC50A-1, SBI System) Resuspend in 1x PBS and store in −80 °C freezers until use. (a) WB results for exosome marker evaluation; PBS served as a negative control. (b) Electron Microscopy of Exosomes. (c) Particle size analysis of exosomes by nanoparticle tracking analyzer.
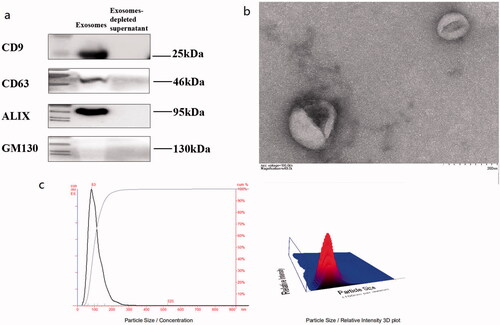
Figure 2. Expression levels of miRNA-615-3p and miRNA-3147 in urinary exosomes. DKD, T2DM and N represent the DKD group, T2DM group and control group, respectively. (a) Expression levels of urinary exosomal miRNA-615-3p in three groups of patients. (b) Expression levels of urinary exosomal miRNA-3147 in three groups of patients.
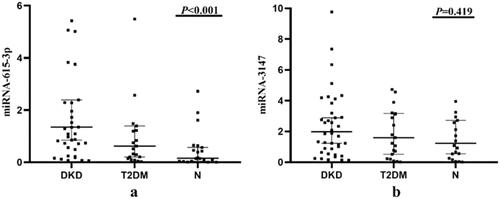
Table 1. Clinical characteristics of the included subjects.
Table 2. Expression levels of miRNA-615-3p and miRNA-3147 in urinary exosomes.
Figure 3. Correlation analysis of urinary exosomal miRNA-615-3p with clinical indicators in DKD group. (a) Scr. (b) BUN. (c) eGFR. (d) PCR. (e) 24 h urine protein. (f) Albumin.
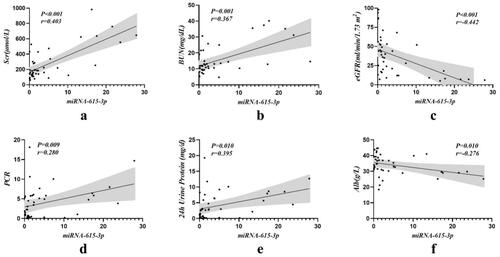
Table 3. Correlation analysis of urinary exosomal miRNA-615-3p and miRNA-3147 with clinical indicators in DKD group.
Table 4. Urinary exosomal miRNA-615-3p in patients with different stages of DKD.
Figure 4. Correlation of urinary exosomal miRNA-615-3p with serum Cystatin C and TGF-β1 in DKD group. (a) Cystatin C-miRNA-615-3p. (b) TGF-β1- miRNA-615-3p.
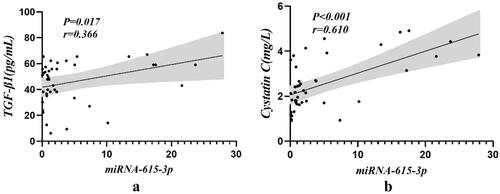
Table 5. Correlation of serum Cystatin C and TGF-β1 expression levels with miRNA-615-3p in DKD patients.
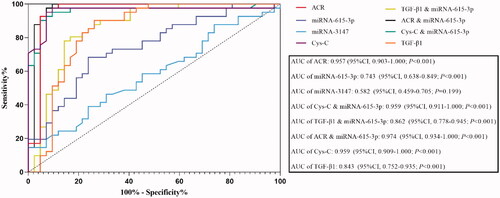
Figure 5. ROC curve analysis results of patients in the DKD group.
Data availability statement
The datasets used and/or analyzed during the current study are available from the corresponding author on reasonable request.