
Figures & data
Figure 1. Enrollment and outcomes of the cohort.
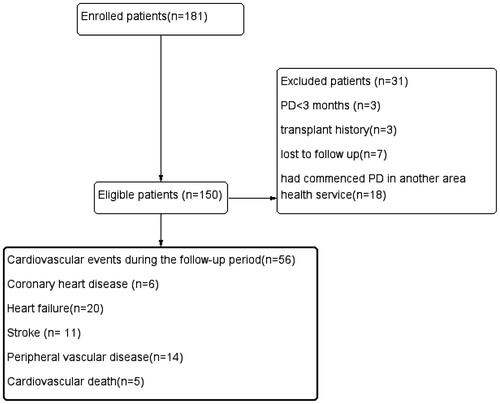
Table 1. Baseline characteristics of the study populations.
Table 2. Results of univariate and multivariate Regression Analysis.
Figure 2. A nomogram for predicting the risk of cardiovascular events in PD patients with peritonitis.
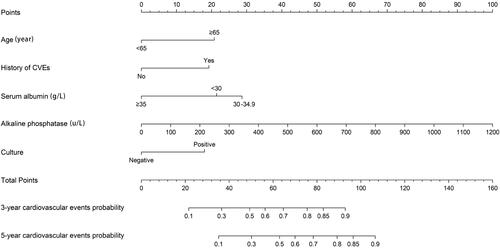
Table 3. Multivariate COX regression model for predicting cardiovascular events in patients with peritoneal dialysis-related peritonitis.
Table 4. The collinearity of the final multivariable model.
Figure 3. ROC curve for time-dependent cardiovascular events in PD patients with peritonitis.
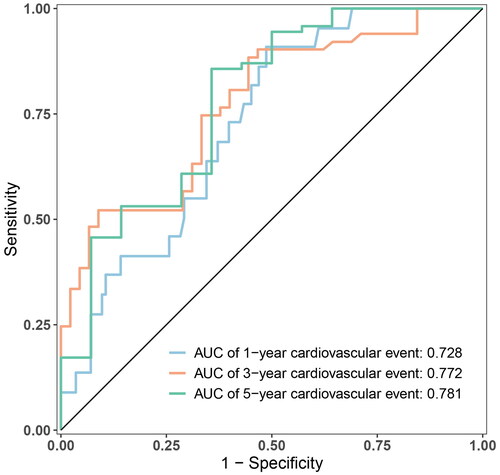
Figure 4. Kaplan-Meier survival curves on the basis of the nomogram.
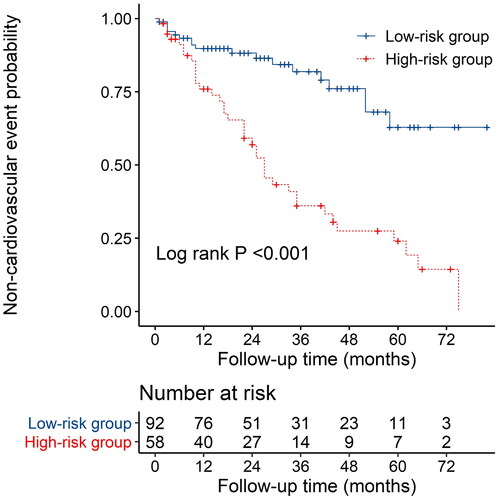
Figure 5. Time-dependent non-cardiovascular events for plots depict the calibration of the nomogram in terms of the agreement between predicted and observed.
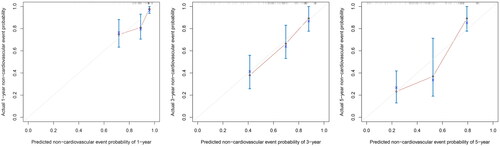
Table 5. Nomogram score for each indicator.
Table 6. Sensitivity analysis and Bootstrap internal validation to test the robustness of the prediction model.
Supplemental Material
Download PDF (121.5 KB)Data availability statement
The data presented in this study are available on request from the corresponding author.