
Figures & data
Figure 1. Flowchart of participants included in the current study.
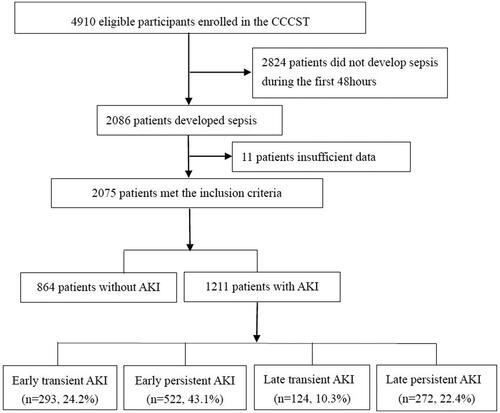
Table 1. Baseline characteristics and outcomes of patients indifferent subgroups according to the timing onset and evolution of AKI.
Table 2. Clinical symptom and library values in subgroup patients according to the timing onset and evolution of AKI.
Figure 2. Sankey diagrams showing the severity of AKI by subgroups. (A)AKI onset; (B) AKI progression; (C) Combine AKI onset and evolution. AKI, acute kidney injury.
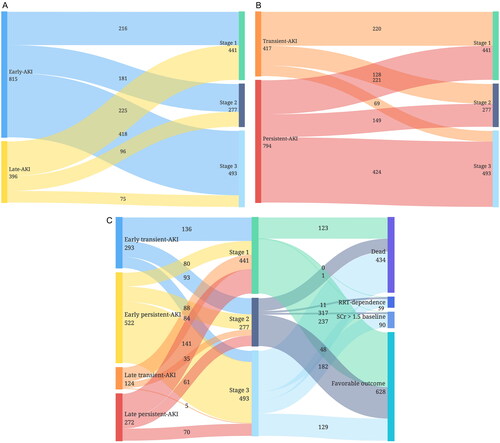
Figure 3. The association between AKI onset, evolution and clinical outcomes.
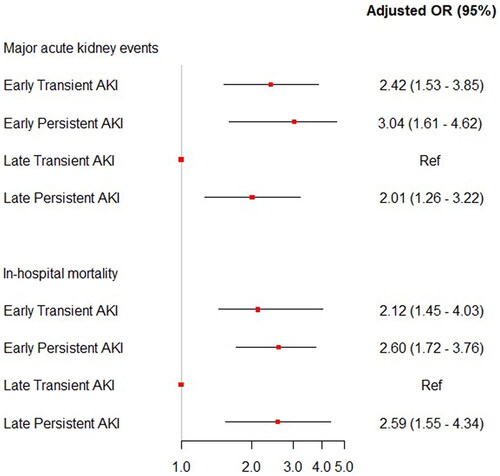
Table 3. Multivariate logistic regression analysis evaluating the risk factors on early persistent-AKI.
Supplemental Material
Download PDF (309.3 KB)Data availability statement
The datasets generated and or analyzed during the current study are available from the corresponding author on reasonable request.