
Figures & data
Figure 1. A flowchart for the selection of elderly patients with AKD. AKD: acute kidney disease; AKI: acute kidney injury; eICU-CRD: the eICU Collaborative Research Database; ESRD: end-stage renal disease; ICU: intensive care unit; MIMIC-IV: medical information mart for intensive care IV.
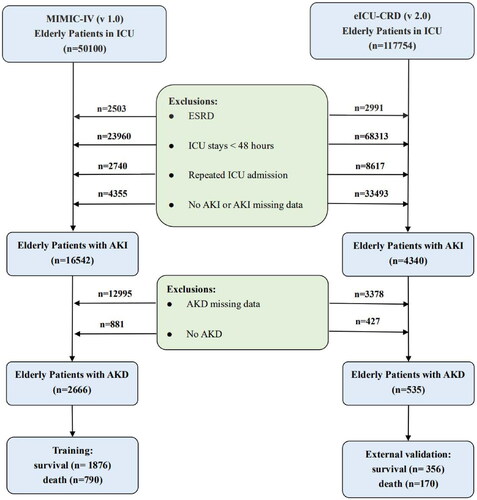
Table 1. Baseline characteristics of elderly patients with AKD.
Figure 2. (a) The ROC curves of the SVM, Simplified SVM, LRM, MLP, RF, and XGB in the training cohort. (b) The ROC curves of the SVM, Simplified SVM, LRM, MLP, RF, and XGB in the external validation cohort. LRM: logistic regression model; MLP: multilayer perceptron; RF: random forest; SVM: support vector machine; XGBoost: extreme gradient boosting.
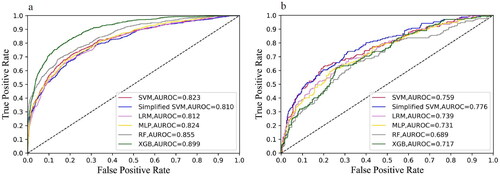
Figure 3. (a) Calibration curves. (b) Decision curve analysis. (c) Precision-Recall curves of the SVM and Simplified SVM in the external validation cohort. SVM: support vector machine.
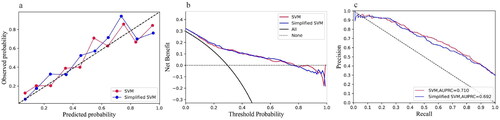
Table 2. The predictive performance of models in the training and external validation cohorts.
Additional file 1. The optimal hyperparameters for five models based on the ten-fold cross-validation.
Figure 4. (a) The distribution of the impacts of features on the SVM model. (b) The ranking of features importance. DBP: diastolic blood pressure; GCS: Glasgow coma scale; MAP: mean artery pressure; MV: mechanical ventilation; SBP: systolic blood pressure; SpO2: peripheral oxygen saturation; SOFA: sequential organ failure assessment.
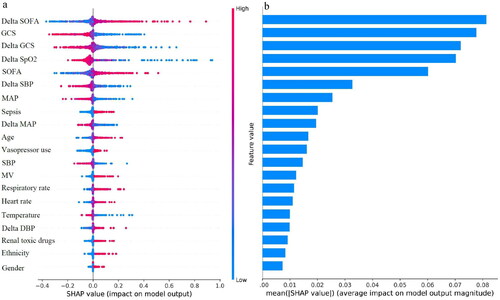
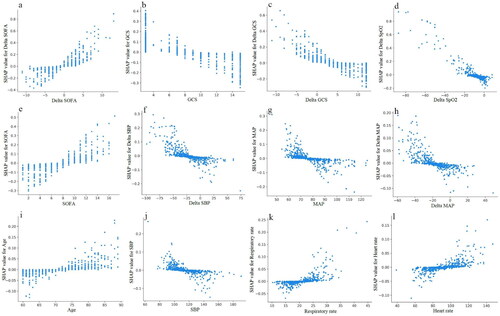
Figure 5. The partial dependence plots of (a) Delta SOFA, (b) GCS, (c) Delta GCS, (d) Delta SpO2, (e) SOFA, (f) Delta SBP, (g) MAP, (h) Delta MAP, (i) Age, (j) SBP, (k) Respiratory rate, and (l) Heart rate. GCS: Glasgow coma scale; MAP: mean artery pressure; SBP: systolic blood pressure; SOFA: sequential organ failure assessment; SpO2: peripheral oxygen saturation.
Data availability statement
The datasets used and/or analyzed during the current study are available from the corresponding author on reasonable request.