Figures & data
Figure 1. The results for the expression levels of NORAD and miR-136-5p in each group of cells after tacrolimus induction. (A) Before NORAD transfection. (B) After NORAD transfection. *p < 0.05, compared to the Control group. #p < 0.05, compared to the Tac and Tac + si-NC groups.
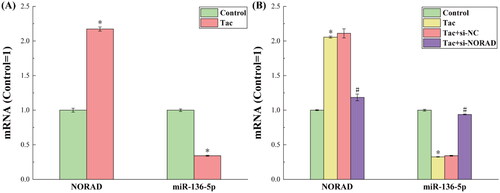
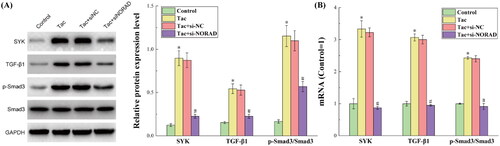
Figure 2. The results for the protein and RNA expression levels of the GF-β1/Smad3 pathway. (A) The results for the protein expression levels detected by western blot. (B) The results for the RNA expression levels detected by RT-qPCR. *p < 0.05, compared to the Control group. #p < 0.05, compared to the Tac and Tac + si-NC groups.
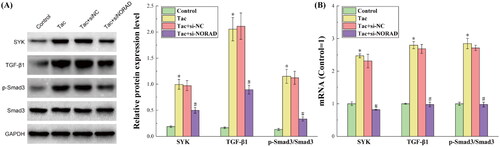
Figure 3. The results for the dual luciferase reporters in detecting the binding of NORAD to miR-136-5p and miR-136-5p to SYK. (A) The normalized luciferase activity of NORAD wt and mut binding to miR-136-5p. (B) The normalized luciferase activity of SYK wt and mut binding to miR-136-5p. *p < 0.05, compared to the Mimic NC group.
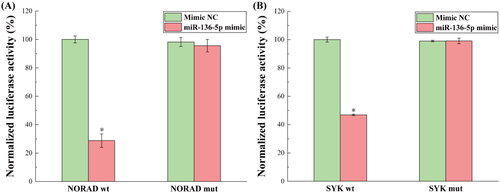
Figure 4. (A) The results for the expression levels of NORAD and miR-136-5p in each group of kidney tissues. (B) The results for the degree of renal fibrosis in mice detected by Masson and PAS staining. *p < 0.05, compared to the Control group. #p < 0.05, compared to the Tac and Tac + si-NC groups.
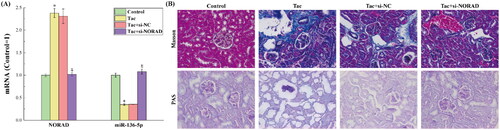
Figure 5. The results for the expression of inflammatory factors IL-1β, IL-6, MCP-1 and TNF-α in each group of kidney tissues detected by ELISA. *p < 0.05, compared to the Control group. #p < 0.05, compared to the Tac and Tac + si-NC groups.
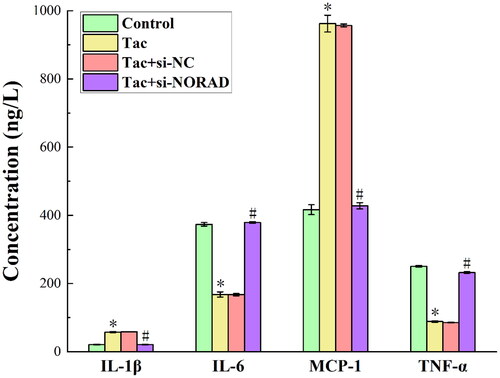
Figure 6. The results for the protein and RNA expression levels of the TGF-β1/Smad3 pathway in each group of kidney tissues. (A) The results for the protein expression levels detected by western blot. (B) The results for the RNA expression levels detected by RT-qPCR. *p < 0.05, compared to the Control group. #p < 0.05, compared to the Tac and Tac + si-NC groups.