
Figures & data
Figure 1. Flow chart. AKI: acute kidney injury.
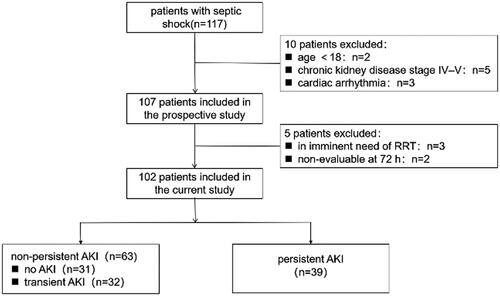
Table 1. Patient characteristics.
Table 2. Logistic regression models for the prediction of persistent AKI.
Figure 2. ROC curve reflecting performance of renal resistive index, the clinical model and their combination for predicting persistent AKI Clinical model includes serum creatinine at inclusion and nonrenal Sequential Organ Failure Score (SOFA). RI: resistive index.
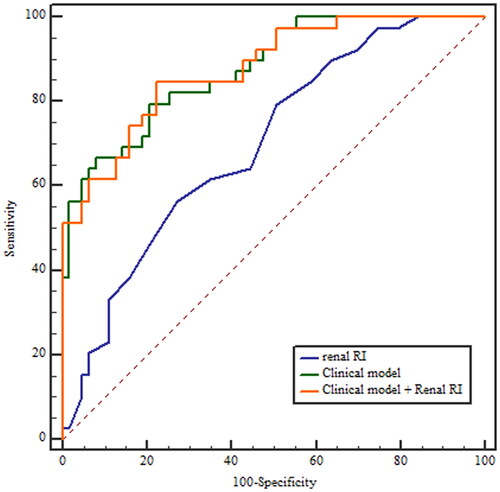
Table 3. Performance of renal RI, the clinical model and their combination for predicting persistent AKI.
Table 4. Performance of renal RI for predicting persistent AKI in different subgroups.
Data availability statement
The datasets used and/or analyzed during the current study are available from the corresponding author on reasonable request.