Figures & data
Figure 1. High glucose increases EZH2 expression and decreases klotho expression. (A) WB revealed that the expression of EZH2 was upregulated and that of klotho was downregulated in HPMCs stimulated with high glucose (HG). (B) Quantitative analysis of the data shown in A. (Data are the mean ± SD, *p < .05 vs. the control (CTR) group, n = 3.).
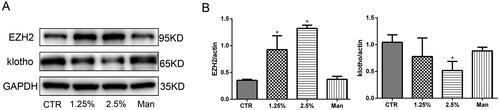
Figure 2. EZH2 was upregulated and klotho was downregulated significantly when HPMCs were stimulated with 2.5% HG for 48 h. (A) WB showed that high glucose increased the expression of EZH2 and decreased the expression of klotho in HPMCs when stimulated for 48 h. (B) Quantitative analysis of the data shown in A (Data are the mean ± SD, *p < .05 vs. the CTR group, n = 3).
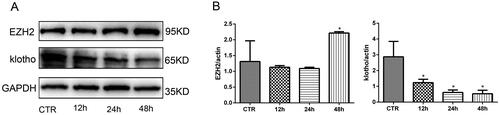
Figure 3. GSK343 mitigated high glucose-induced EMT and migration capacity. (A) The expression of E-cadherin, N-cadherin and vimentin was significantly reversed by GSK343 compared with that in the HG group when HPMCs were treated with high glucose in the presence or absence of GSK343. (B) Quantitative analysis of the data shown in A. (C) A wound-healing assay showed that GSK343 could inhibit the migration capacity induced by HG. (D) Transwell assays revealed that the high glucose-induced high migration capacity was relieved by GSK343. Statistical analysis of the results shown in Panels C and D was conducted (Data are the mean ± SD; *p < .05 vs. CTR group, #p < .05 vs. high glucose (HG) group, n = 3).
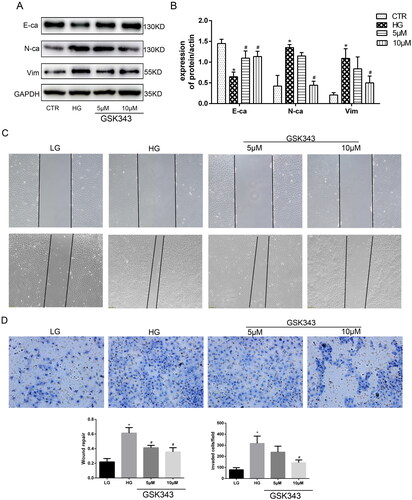
Figure 4. GSK343 relieved lipid deposition in vitro and in vivo. (A) Oil red O staining of HPMCs showed that high glucose-induced lipid accumulation could be attenuated by GSK343. (B) Nile red staining of HPMCs exhibited results similar to those demonstrated in Panel A. (C) TG quantitative determination of cells treated with high glucose in the presence or absence of GSK343 was conducted. The results showed that GSK343 could significantly reduce the TG content induced in the HG group. (D) The TG content of peritoneal tissue in different groups was detected by a TG detection assay kit. The results showed that GSK343 reduced the TG content compared with that in the PDF group (Data are the mean ± SD; *p < .05 vs. CTR group, #p < .05 vs. HG/PDF group, n = 3).
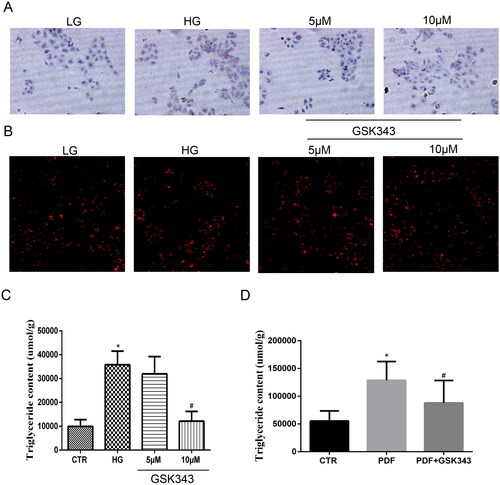
Figure 5. GSK343 restored the expression of EZH2 and klotho induced by high glucose. (A) The expression of EZH2 and klotho stimulated with high glucose in the presence or absence of GSK343 was detected by WB. The results showed that GSK343 could significantly reverse the expression of EZH2 and klotho compared with that in the HG group. (B) Quantitative analysis of the data shown in Panel A (Data are the mean ± SD; *p < .05 vs. CTR group, #p < .05 vs. HG group, n = 3).
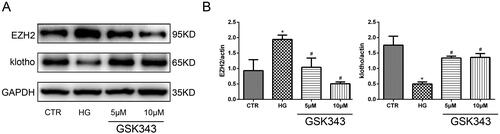
Figure 6. Rescue experiments showed that klotho mediated the protective effect of GSK343 on EMT and lipid accumulation. (A) WB revealed that the expression of E-cadherin, N-cadherin and vimentin was restored when HPMCs were treated with si-klotho compared with the HG + GSK343 group. (B) Quantitative analysis of the data shown in A. (C) WB revealed that the expression of klotho was restored when HPMCs were treated with si-klotho compared with the HG + GSK343 group. (D) Quantitative analysis of the data shown in C. (E) TG quantitative determination showed that the TG content was upregulated in the si-klotho + HG + GSK343 group compared with the HG + GSK343 group (Data are the mean ± SD; *p < .05 vs. HG + GSK343 group, n = 3).
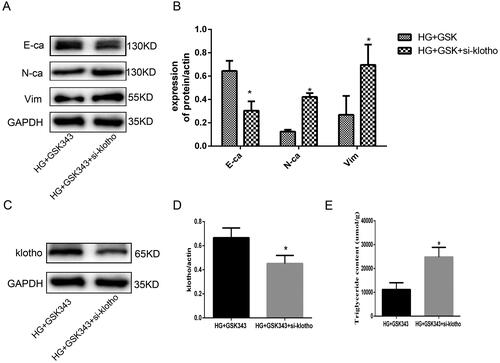
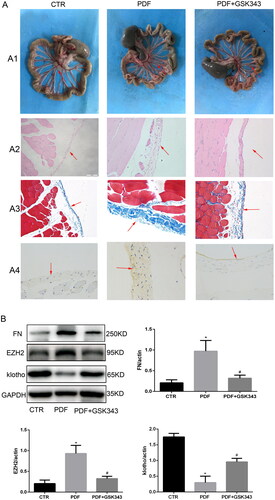
Figure 7. GSK343 alleviated PD-related peritoneal fibrosis and reversed the expression of klotho. (A) (A1) General images of the visceral peritoneum, (A2) HE staining of the parietal peritoneum, (A3) Masson staining of the parietal peritoneum and (A4) IHC of FN. All of the above results demonstrated that GSK343 could relieve peritoneal thickness, fibrosis and FN expression. (B) WB revealed that the expression of FN, EZH2 and klotho was significantly reversed by GSK343 compared with that in the PDF group (Data are the mean ± SD; *p < .05 vs. PDF group, n = 3).