
Figures & data
Figure 1. Flow chart of the 321/1000 patients selected from our patients in the chronic hemodialysis program.
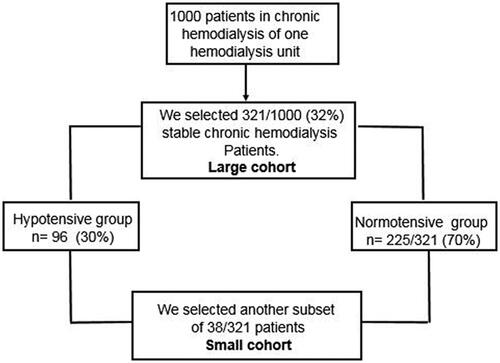
Table 1. Demographics of the large cohort.
Figure 2. The figure shows a very significant negative correlation after UF, between the decreases in the systolic blood pressure vs the fall in percent of plasma volume, in 321 cases. (r = -0.232, p < 0.0001).
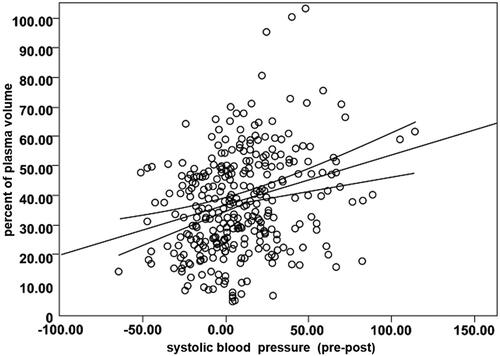
Table 2. Results of the BP and the body weight before and after UF in the large cohort (n = 321).
Table 3. Depicts the data of the large cohort divided in two groups those with a fall of ≤20 mmHg Normotensive group; and a drop of >20 mmHg, Hypotensive group; and the % of diabetic patients in both groups.
Table 4. The 321 patients were divided in two groups SBP Pre HD ≤140 and ≥140 mmHg.
Table 5. Data of the small cohort (38 patients) obtained from the 321 patients with the propensity score matching.
Table 6. Shows the results of the SBP, MAP and bioimpedance pre and post HD; plus the % PV and FO, in the small cohort.
Figure 3. Change in Hb concentration after UF in the post and 2 h period in the small subgroup. Hb Prep (Hb 48/72 h). Differences between Hb Pre and Hb Prep (48/72 h) were NS. Hb Post and Hb 2 h were NS. Hb Pre and Prep were different from Hb Post and Hb 2 h (p < 0.001).
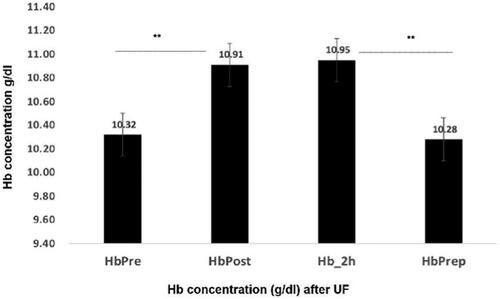
Figure 4. Recovery of percent of plasma volume, 2 hs after Uf, in the 38 cases studied (sub-group). Difference was NS.
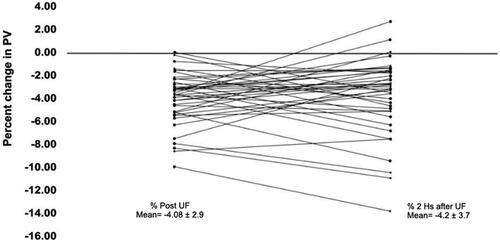
Figure 5. Pre TBW and pre ECW decrease significantly in post TBW and post ECW; TBW 2H and ECW, 2H TBW 2 h (p < 0.001). The recovery of TBW and ECW was complete at TBW Prep (48/72 hs) and ECW Prep. TBW Pre and ECW Pre were non different from TBW Prep and ECW Prep.
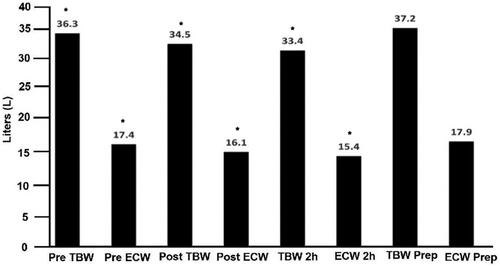
Figure 6. Percent of water removed showed a high inverse correlation, (r = -0.70, p < 0.0001). The larger the water retained the lower the percent of water removed.
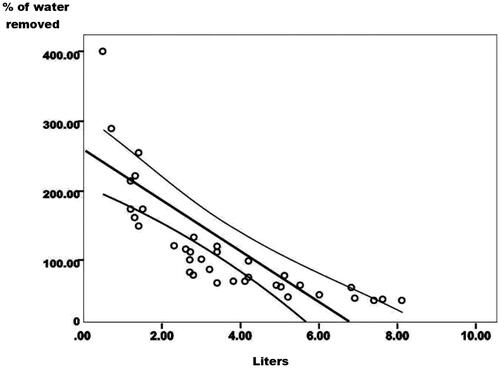
Table 7. Values of total Hb (THb) and Erythrocyte mass (EM) in the three periods, pre, post and 48/72 h. The differences were non-significant in the three periods.