Figures & data
Figure 1. Flowchart of enrolled patients. A total of 50 patients were included in our study. Patients were divided into two groups depending on preoperative KRT: the control (non-KRT) group (n = 33) and the KRT group (n = 17). Analysis for baseline characteristics and survival was performed. Linear fixed effects analysis regarding post-LVAD eGFR was performed after excluding patients who expired before 1 year after LVAD implantation (n = 2 in the control group and n = 3 in the KRT group).
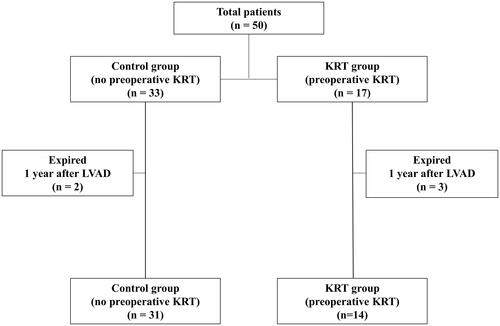
Table 1. Baseline characteristics.
Figure 2. Changes in eGFR depending on preoperative KRT. In all patients, eGFR was significantly improved after LVAD implantation. At each time point up to 3 years after LVAD implantation, eGFR of the KRT group was lower than that of the control group. However, there was no statistical difference in the degree of eGFR decline over postoperative time between the two groups (p = 0.57). *p < 0.05 compared with the control group at each time point. The eGFR are presented as mean ± SD at the time point.
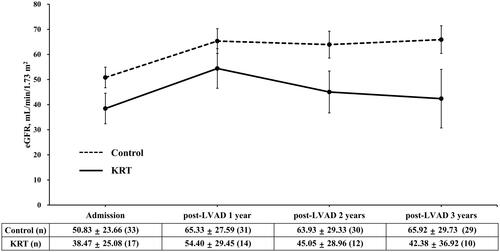
Table 2. Patient outcomes.
Table 3. Changes in eGFR after LVAD implantation according to preoperative KRT and other variables.
Figure 3. Kaplan–Meier curves for post-LVAD ESKD during the follow-up period after LVAD implantation. Kaplan–Meier curves showed a significant difference in the cumulative prevalence of post-LVAD ESKD between the control and KRT groups (log rank p = 0.008).
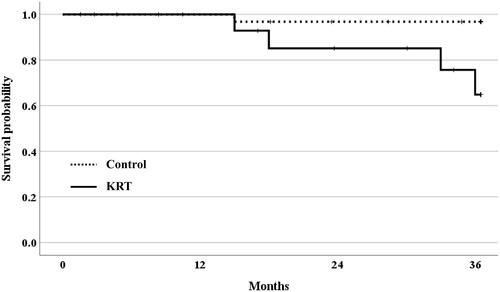
Figure 4. Kaplan–Meier curves for survival during the follow-up period after LVAD implantation. Kaplan–Meier curves showed no significant difference in the cumulative survival between the control and KRT groups (log rank p = 0.16).
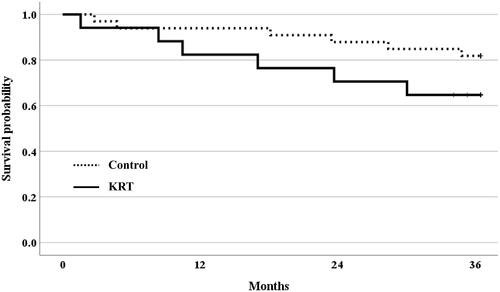
Table 4. Subgroup analysis according to the initiation timing of KRT.
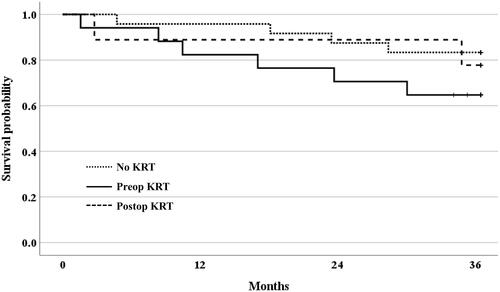
Figure 5. Kaplan–Meier survival curves according to the initiation timing of KRT. Kaplan–Meier curves showed no significant difference in the cumulative survival among the no KRT, preoperative KRT, and postoperative KRT groups (log rank p = 0.35).