
Figures & data
Figure 1. Flowchart of study participants.
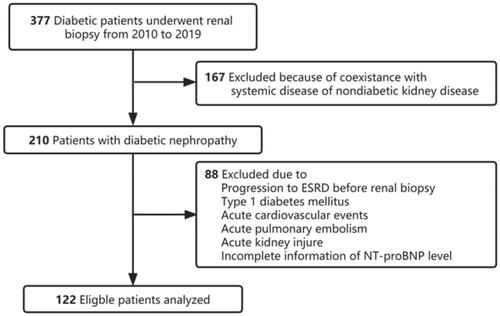
Table 1. The clinical characteristics according to the plasma NT-proBNP concentrations.
Figure 2. ROC curve analysis of the NT-proBNP level for prediction of progression of diabetic kidney disease.
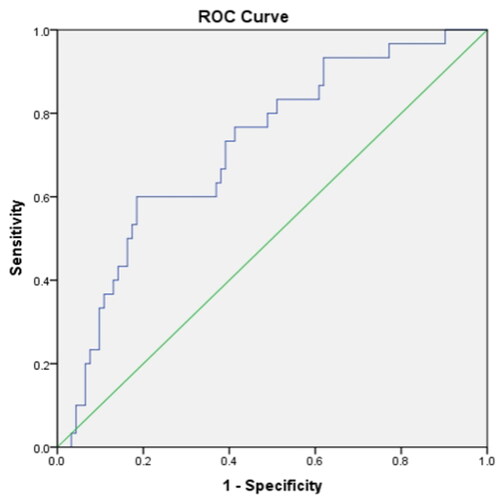
Table 2. Baseline pathological characteristics according to the plasma NT-proBNP concentrations.
Table 3. Associations between NT-proBNP concentration and clinical covariates.
Figure 3. Kaplan–Meier curves of renal survival rate in patients with different plasma NT-proBNP concentrations. Log rank p = 0.001.
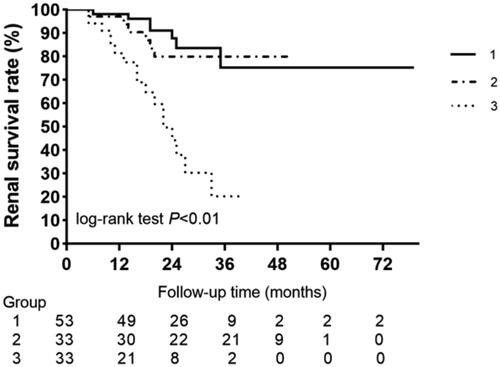
Table 4. Univariable and multivariable Cox proportional hazard analysis. Associations between NT-proBNP level and renal outcomes.
Supplemental Material
Download PDF (260.3 KB)Data availability statement
The datasets generated during and analyzed during the current study are available from the corresponding author upon reasonable request.