
Figures & data
Figure 1. Receiver operating characteristic (ROC) analysis of the baseline abdominal aortic calcification (AAC) score for mortality. The area under the ROC curve is 0.714 (95% confidence interval, 0.659–0.769, p < 0.001). The cutoff value of the AAC score is 4.5 (sensitivity 67.3%, specificity 70.4%).
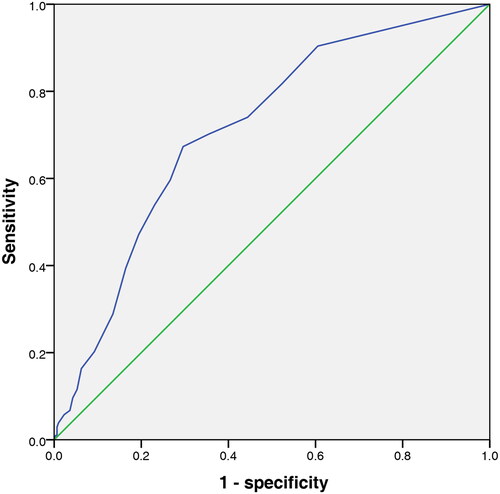
Figure 2. Kaplan–Meier analysis of all-cause and cardiovascular deaths of 408 hemodialysis patients. The blue line denotes the patients with an AAC score ≤ 4.5 (248 patients) and the green line denotes the patients with an AAC score > 4.5 (160 patients). (a) The patients with an AAC score > 4.5 had a higher death rate from all causes than those with an AAC score ≤ 4.5 (log-rank test, p < 0.001). (b) The patients with an AAC score > 4.5 had a higher death rate from cardiovascular mortality than those with an AAC score ≤ 4.5 (log-rank test, p < 0.001).
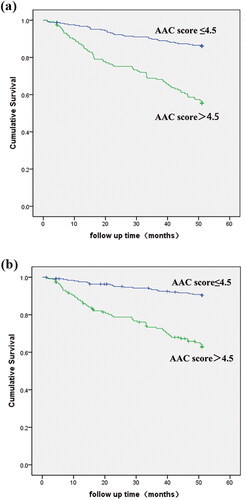
Table 1. Demographic characteristics of hemodialysis patients with AAC scores below and above 4.5.
Table 2. Univariate Cox proportional hazards analysis of factors associated with all-cause and cardiovascular death in hemodialysis patients.
Table 3. Multivariate Cox proportional hazards analysis of factors associated with all-cause and cardiovascular death in hemodialysis patients.
Data availability statement
Datasets are available from the corresponding author on reasonable request.