
Figures & data
Table 1. Characteristics of participants by anxiety disorders.
Figure 1. Cumulative event-free survival (Kaplan–Meyer curves) for progression of DKD. Significant difference was shown in estimated mean time free of DKD progression by anxiety status (log rank p < 0.001). DKD: diabetic kidney disease.
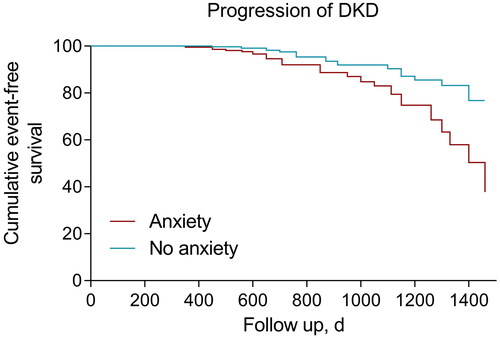
Table 2. Characteristics of participants by progression of diabetic nephropathy.
Table 3. Association between anxiety and progression of diabetic nephropathy in type 2 diabetes.
Data availability statement
The datasets during and/or analyzed during the present study are available from the corresponding author on reasonable request.