
Figures & data
Figure 1. Study procedures, including patients’ selection and their outcomes.
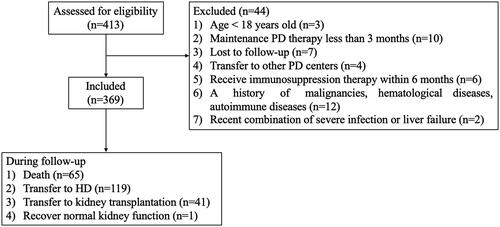
Table 1. Demographic characteristics and laboratory data of the study population.
Figure 2. ROC curves of the probability of AISI, SII and SIRI in predicting all-cause mortality.
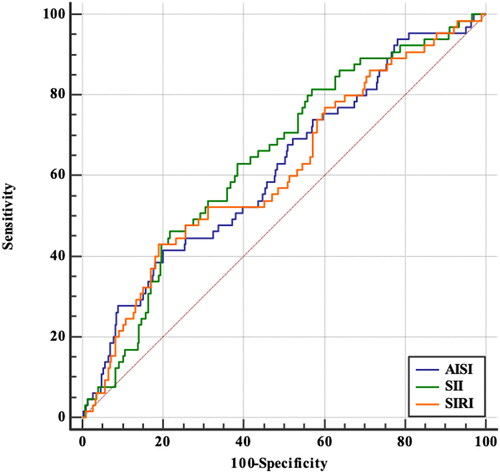
Figure 3. Kaplan–Meier curves for all-cause mortality in peritoneal dialysis patients with different cutoff values of the blood cell count-derived inflammation indexes. (a): AISI; (b): SII; (c): SIRI.
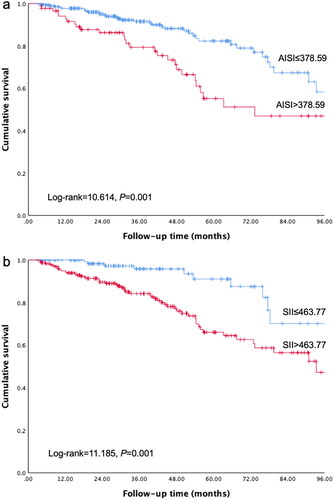
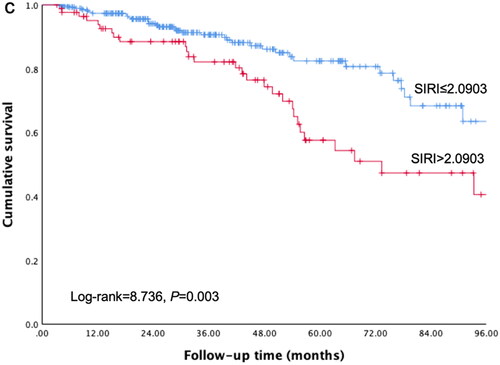
Table 2. Optimal cutoff values and AUC of blood cell count-derived inflammation indexes.
Table 3. Univariate Cox analysis of all-cause mortality in peritoneal dialysis patients.
Table 4. Hazard ratios of blood cell count-derived inflammation indexes by multivariate Cox analysis of inflammation indexes.
Supplemental Material
Download PDF (77.2 KB)Data availability statement
The data used to support the findings of this study are available from the corresponding author upon request.