
Figures & data
Figure 1. Flow chart of the procedure of study participant recruitment.
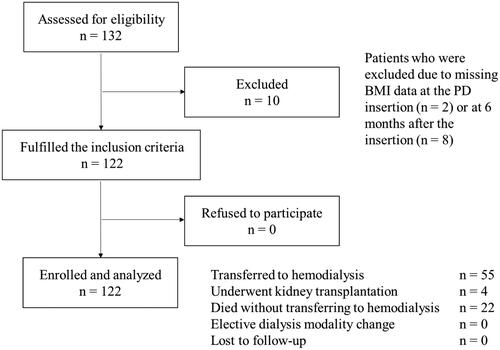
Table 1. Baseline characteristics of the study population and the groups divided according to body mass index change (T1: BMI change: < −4.13%, T2: BMI change: −4.13–0.67%, and T3: BMI change: >0.67%).
Table 2. Causes of HD transfer among tertile categories.
Figure 2. Kaplan–Meier curves (A) and Cumulative incidence curves (B) for death or hemodialysis transfer in the T1, T2, and T3 groups.
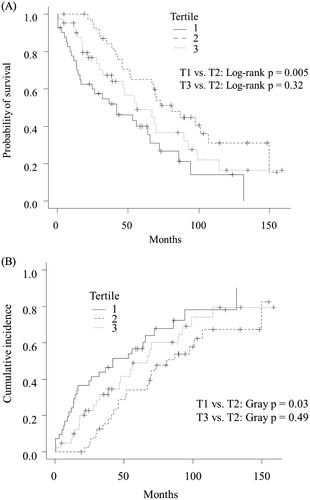
Table 3. Association between BMI change and death or HD transfer in patients on PD using standard Cox regression model and Fine and Gray sub-distribution hazards model.
Figure 3. Restricted cubic spline curves showing death or transfer to hemodialysis for the unadjusted (A) and multivariable-adjusted model 1 (B), model 2 (C), and model 3 (D). In splines, solid lines represent the hazard ratio and dashed lines represent the 95% confidence interval.
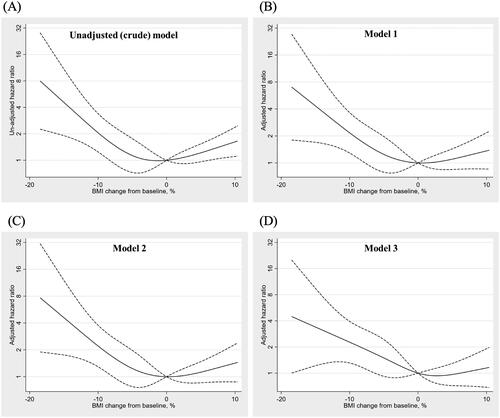
Table 4. Association between the BMI change and peritonitis or heart failure in patients on PD using the standard Cox regression model.