
Figures & data
Table 1. Survival status of mice after 12 weeks of treatment.
Figure 1. TP improved renal function and histopathological injury in DN mice. The DN mouse model was induced by HFD feeding combined with STZ injection. After 12 weeks of treatment with TP, (A) FBG was detected by glucose meter; (B) 24 h UAlb in mice was detected by Bradford method; (C,D) The serum contents of SCr and BUN in mice were detected using an automated biochemical analyzer; (E) The ratio of K/B weight was examined; (F) H&E staining was used to analyze the pathological changes of renal tissues in mice and to quantify the percentage of inflammatory areas; (G) TUNEL staining was used to detect the percentage of apoptosis in renal tissues. Data were expressed as mean ± SD, N = 6. One-way ANOVA was used for data comparison among multiple groups and Tukey’s test was used for the post-hoc test. p-Value was obtained from the bilateral tests. **p < 0.01, ***p < 0.001.
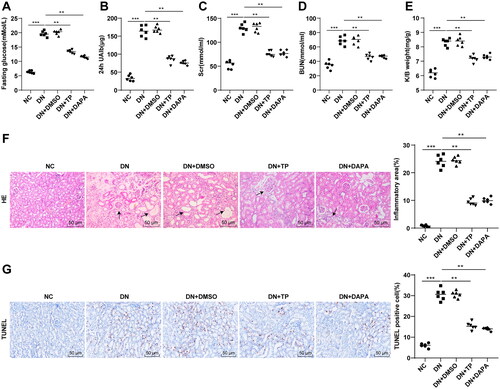
Figure 2. TP alleviated podocyte injury in DN mice. (A) The morphological and structural changes of podocytes in mouse kidney tissue were observed by TEM and the average number of podocytes and podocyte foot processes in glomeruli were quantitatively analyzed; (B) The number of Nephrin-positive cells was detected by immunohistochemistry; (C) The protein levels of Nephrin and Podocin in mouse kidney tissues were detected by WB. Data were expressed as mean ± SD, N = 6. One-way ANOVA was used for data comparison among multiple groups and Tukey’s test was used for the post-hoc test. **p < 0.01, ***p < 0.001.
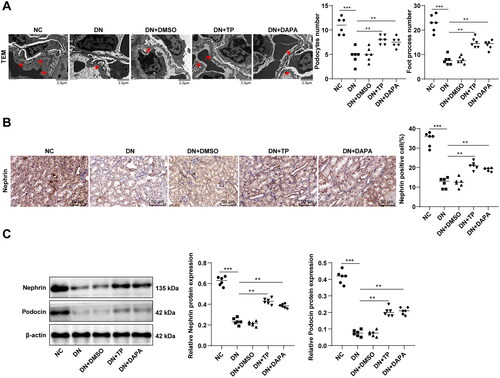
Figure 3. TP improved OS injury and activated the Nrf2/HO-1 pathway in renal tissue of DN mice. (A) DCFH-DA kits were used to detect ROS levels in mouse renal tissues; (B–D) The levels of OS-related enzymes, such as MDA, SOD, and GSH were detected; E: The levels of the Nrf2/HO-1 pathway-related proteins in mouse kidney tissues were detected by WB. Data were expressed as mean ± SD, N = 6. One-way ANOVA was used for data comparison among multiple groups and Tukey’s test was used for the post-hoc test. **p < 0.01, ***p < 0.001.
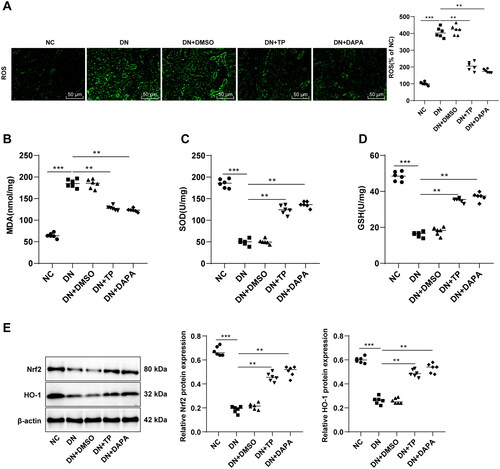
Figure 4. TP reduced pyroptosis of renal tissue in DN mice by inhibiting the NLRP3 inflammasome pathway. (A) ELISA kits were used to detect the secretion levels of inflammatory cytokines IL-1β and IL-18 in the serum of mice; (B,C) WB was used to detect the protein level of cell pyroptosis markers mediated by NLRP3 inflammasome in mouse kidney tissue. Data were expressed as mean ± SD, N = 6. One-way ANOVA was used for data comparison among multiple groups and Tukey’s test was used for the post-hoc test. **p < 0.01, ***p < 0.001.
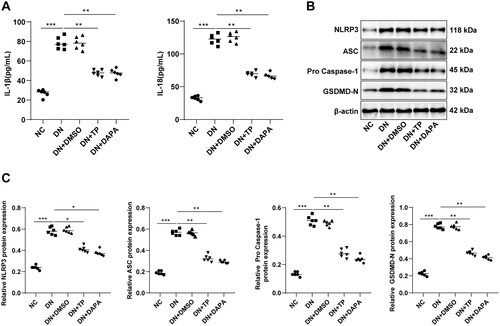
Figure 5. TP attenuated MPC5 cell damage induced by HG. (A) The positive expression of podocyte marker Nephrin in MPC5 cells was detected by immunofluorescent staining; (B) MPC5 cell viability was detected by MTT assay; (C) Hoechst 33342/PI double fluorescence staining was used to detect the pyroptosis level of MPC5 cells. Data were expressed as mean ± SD, and the cell experiments were independently repeated three times. One-way ANOVA was used for data comparison among multiple groups and Tukey’s test was used for the post-hoc test. **p < 0.01, ***p < 0.001.
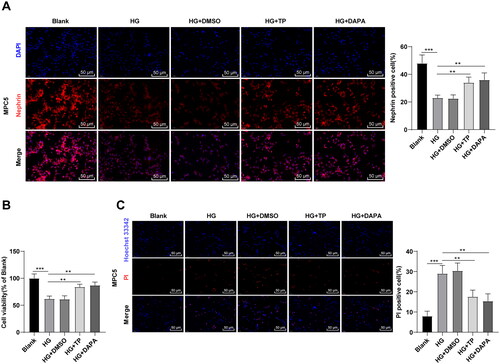
Figure 6. TP activated the Nrf2 pathway to reduce OS induced by HG in MPC5 cells. (A) ROS levels in MPC5 cells were detected by a DCFH-DA fluorescence probe; (B) WB was used to detect Nrf2 and HO-1 protein levels; (C–E) The MDA, SOD, and GSH levels were determined. Data were expressed as mean ± SD; cell experiments were independently repeated three times. One-way ANOVA was used for data comparison among multiple groups and Tukey’s test was used for the post-hoc test. *p < 0.05, **p < 0.01, ***p < 0.001.
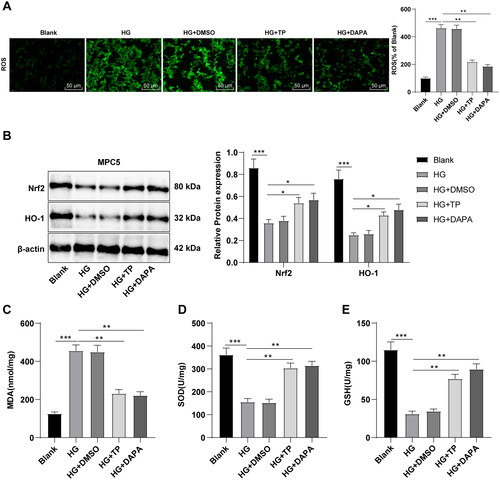
Figure 7. TP alleviated pyroptosis in HG-induced MPC5 cells by inhibiting the NLRP3 inflammasome pathway. (A) WB was used to detect the protein levels of pyroptosis markers in NLRP3 inflammasome in MPC5 cells; (B) The secretion levels of IL-1β and IL-18 were detected by ELISA kits. Data were expressed as mean ± SD, and cell experiments were independently repeated three times. One-way ANOVA was used for data comparison among multiple groups and Tukey’s test was used for the post-hoc test. *p < 0.05, **p < 0.01, ***p < 0.001.
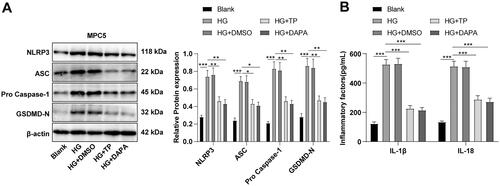
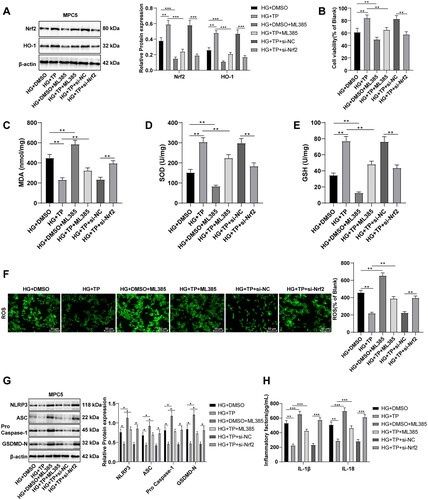
Figure 8. TP protected HG-treated MPC5 cells by activating Nrf2 to scavenge ROS and inhibit the NLRP3 inflammasome pathway. (A) The protein levels of Nrf2 and HO-1 in MPC5 cells were detected by WB; (B) MPC5 cell activity was detected by MTT; (C–E) The levels of MDA, SOD, and GSH in MPC5 cells were detected; (F) ROS levels in MPC5 cells were detected by a DCFH-DA fluorescence probe; (G) WB was used to detect the levels of NLRP3 inflammasome pathway-related proteins; (H) The secretion levels of inflammatory cytokines IL-1β and IL-18 were detected by ELISA; Data were expressed as mean ± SD, and the cell experiments were independently repeated three times. Comparison between two groups was performed by the t-test. *p < 0.05, **p < 0.01, ***p < 0.001.
Data availability statement
The data that support the findings of this study are available from the corresponding author upon reasonable request.