
Figures & data
Figure 1. Flow chart of selected patients.
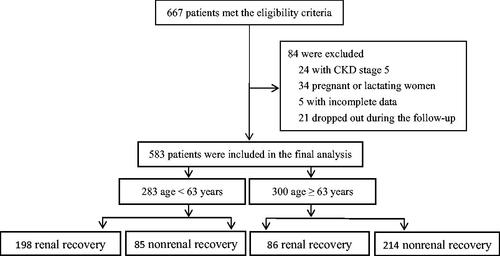
Table 1. Comparison of demographic and clinical characteristics for the study population.
Figure 2. The ROC curve of risk factors for the prediction of the nonrenal recovery (A) and renal recovery (B) of AKI in the age < 63 years cohort, and the risk factors for the prediction of the nonrenal recovery (C) and renal recovery (D) of AKI in the age ≥ 63 year cohort.
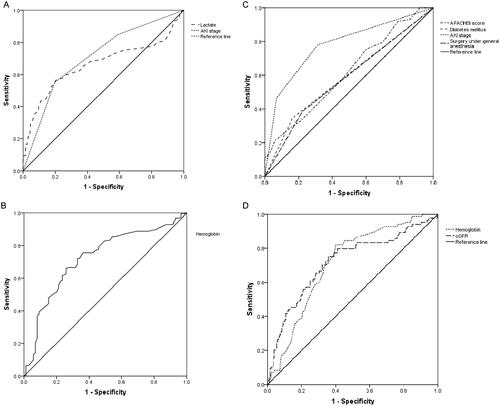
Table 2. Multivariate logistic regression analysis for nonrenal recovery in AKI cohorts of different ages.
Data availability statement
The datasets used and/or analyzed during the current study available from the corresponding author on reasonable request.