Figures & data
Scheme 1. Schematic diagram of phosphoproteomic analysis of SFO in HC group.
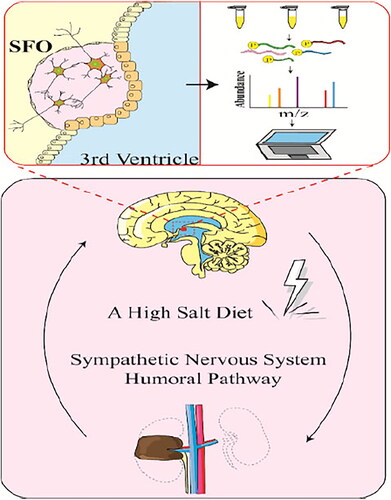
Figure 1. Characterization of phosphopeptides and phosphosites. (a) The Ser, Thr, and Tyr phosphosites with high confidence in SFO phosphoproteome distribution. (b) Percentage distribution of singly, doubly, triply, and quadruply phosphorylated peptides with high confidence. (c,d) Frequency distribution of phosphopeptides quantitation ratio at NC/NS or HC/NC. (e,f) Frequency distribution of differentially phosphorylated peptides ratio at NC/NS or HC/NC. NS: sham operation + normal salt diet; NC: 5/6 Nx + normal salt diet; HC: 5/6 Nx + high salt diet; 5/6 Nx: 5/6 nephrectomy; SFO: subfornical organ.
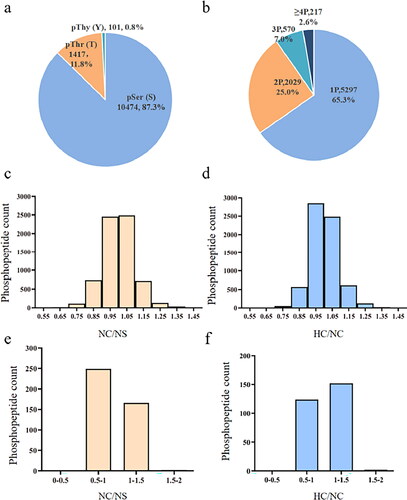
Table 1. Changes in biochemical and metabolic parameters.
Figure 2. GO analysis of differentially phosphorylated peptides in NC/NS and HC/NC comparison groups. GO analysis of phosphoproteins differently expressed in NC/NS and HC/NC comparison groups based on the molecular function (a,c) and biological process (b,d) using PANTHER classification. NS: sham operation + normal salt diet; NC: 5/6 Nx + normal salt diet; HC: 5/6 Nx + high salt diet; 5/6 Nx: 5/6 nephrectomy.
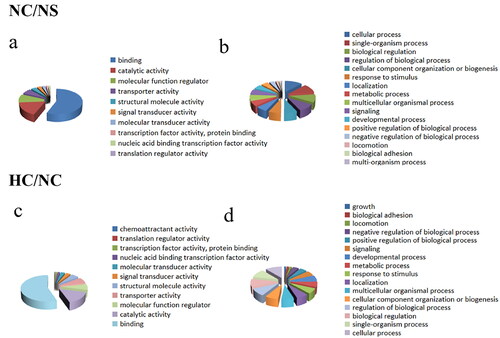
Table 2. Two representative differential phosphoproteins in HC/NC comparison group.
Figure 3. High salt intake induced significant phosphorylation changes of Hsp27 and GAP43. Phosphorylation level of Hsp27(Ser15) (a) and GAP43(Ser41) (b) were validated by western blotting. Data are expressed as the mean±SD of three independent experiments (n = 8 in each group). *p < 0.001 vs. NS group or NC group. NS: sham operation + normal salt diet; NC: 5/6 Nx + normal salt diet; HC: 5/6 Nx + high salt diet; 5/6 Nx: 5/6 nephrectomy.
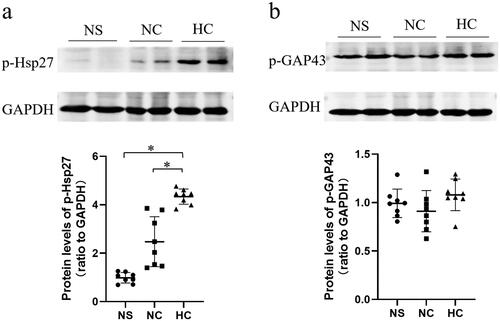
Figure 4. STRING analysis revealed protein interaction networks in SFO phosphoproteome in NC/NS comparison group. Interactions of the identified phosphoproteins were mapped using Search Tool for the Retrieval of Interacting Genes/Proteins database version 9.0 with a confidence cutoff of 0.6. Proteins are presented as nodes connected by lines in the resulting protein association network. The yellow node is the target protein, and the blue node is the other protein that does not directly interact with the target protein. NS: sham operation + normal salt diet; NC: 5/6 Nx + normal salt diet; 5/6 Nx: 5/6 nephrectomy; SFO: subfornical organ.
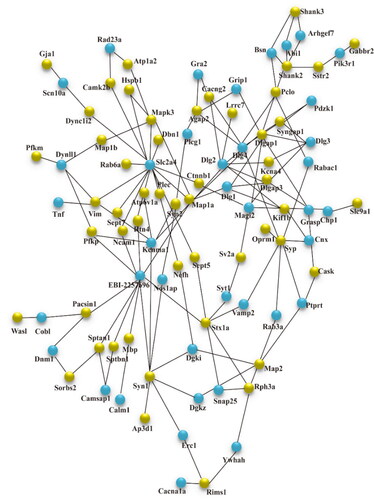
Figure 5. STRING analysis revealed protein interaction networks in SFO phosphoproteome in the HC/NC comparison group. Interactions of the identified phosphoproteins were mapped using the Search Tool for the Retrieval of Interacting Genes/Proteins database version 9.0 with a confidence cutoff of 0.6. Proteins are presented as nodes connected by lines in the resulting protein association network. The yellow node is the target protein, and the blue node is the other protein that does not directly interact with the target protein. NC: 5/6 Nx + normal salt diet + normal salt diet; HC: 5/6 Nx + high salt diet; 5/6 Nx: 5/6 nephrectomy; SFO: subfornical organ.
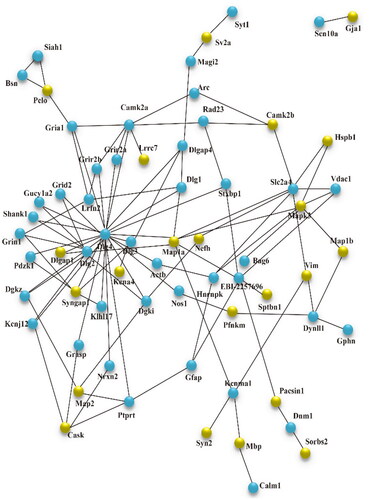
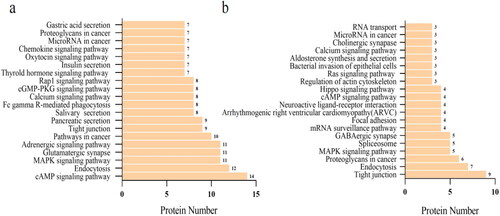
Figure 6. KEGG pathway analysis of differential phosphoproteins in the NC/NS and HC/NC comparison groups. The differential phosphoproteins enriched the top 20 signaling pathways in the NC/NS (a) and HC/NC (b) comparison groups. The horizontal axis is the number of proteins, whereas the vertical ordinates are the terms of KEGG pathways. NS: sham operation + normal salt diet; NC: 5/6 Nx + normal salt diet; HC: 5/6 Nx + high salt diet; 5/6 Nx: 5/6 nephrectomy.