
Figures & data
Figure 1. Flow chart of patients in the study group.
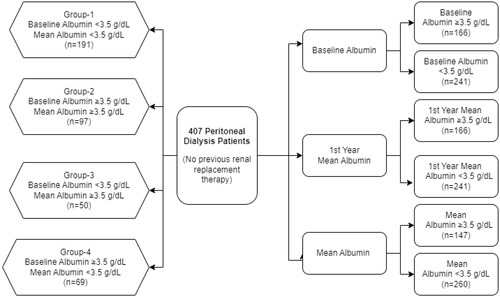
Table 1. Pearson correlation for scaled schoenfeld residuals of significant covariates with time.
Figure 2. Kaplan–Meier log-rank analysis of RRF loss by albumin values and groups. (A) Analysis of RRF loss relative to the 3.5 g/dl level of mean albumin. (B) Analysis of RRF loss relative to 3.5 g/dl of baseline albumin. (C) Analysis of RRF loss relative to the 1st year mean albumin level of 3.5 g/dl. (D) Analysis of RRF loss by group-1, group-2, group-3, and group-4. p < 0.05 was considered statistically significant.
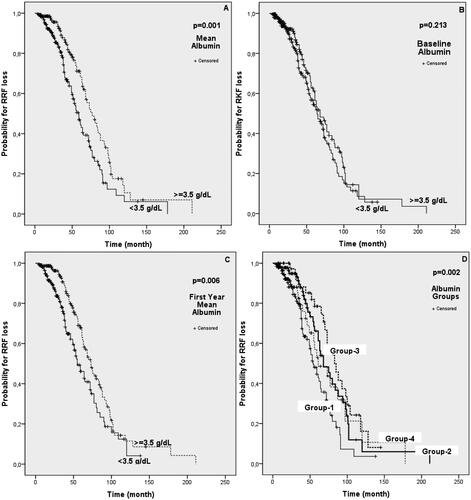
Table 2. Comparison of demographic, clinical, RRF, and peritonitis rates of peritoneal patients according to baseline, 1st-year, and mean albumin levels.
Figure 3. Kaplan–Meier analysis of first peritonitis episode risk by albumin values and groups. (A) Analysis of first peritonitis episode risk relative to the mean albumin level of 3.5 g/dl. (B) Analysis of first peritonitis episode risk relative to 3.5 g/dl of baseline albumin. (C) Analysis of first peritonitis episode risk based on the 1st year mean albumin level of 3.5 g/dl. (D) Analysis of first peritonitis episode risk according to group-1, group-2, group-3, and group-4. p < 0.05 was considered statistically significant.
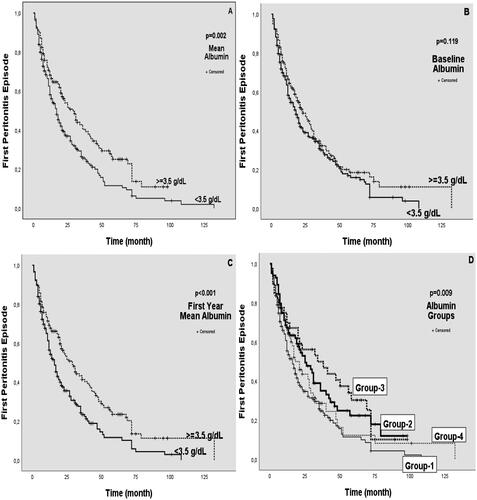
Figure 4. Kaplan–Meier analysis of mortality by albumin values and groups. (A) Mortality analysis based on the 3.5 g/dl level of the mean albumin. (B) Mortality analysis based on 3.5 g/dl of baseline albumin. (C) Mortality analysis based on the 1st year mean albumin level of 3.5 g/dl. (D) Mortality analysis by group-1, group-2, group-3, and group-4. (E) ROC analysis graph showing mortality estimation by baseline, mean, and 1st year mean albumin values. p < 0.05 was considered statistically significant.
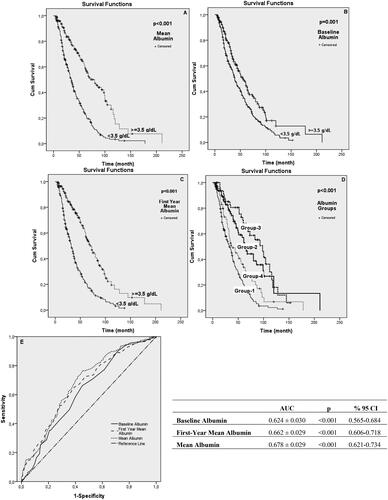
Table 3. Comparison of mortality of peritoneal dialysis patients according to baseline, 1st year, and mean albumin levels.
Table 4. Comparison of demographic, clinical, RRF, and peritonitis rates according to baseline and mean albumin values.
Table 5. Comparison of mortality according to baseline and mean serum albumin values.
Figure 5. Pearson correlation plot of first year mean albumin and mean albumin values. There was a positive correlation between 1st year mean albumin values and mean albumin values (Pearson = 0.944, p < 0.001).
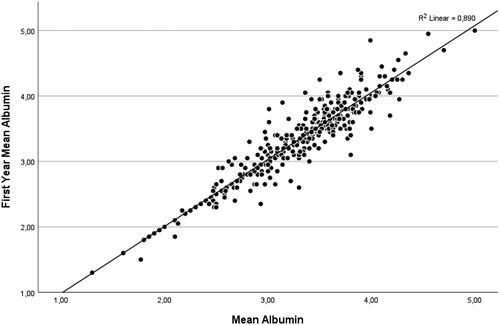
Table 6. Multivariate cox proportional hazards regression analysis showing factors affecting mortality.
Data availability statement
You can reach from the link: https://docs.google.com/document/d/1WXYBx-I5KpLexZqcYCJ_8A4TF40gffHC/edit?usp=sharing&ouid=106512140084758313140&rtpof=true&sd=true.