Figures & data
Table 1. Primer information.
Figure 1. Isolation, identification, and internalization of exosomes derived from BMSCs. (A) Observation by transmission electron microscopy; (B) measurement of exosome size by nano-particle tracking molecule; (C) detection of BMSC-exos markers by western blot analysis; (D) detection of BMSC-exo markers by flow cytometry; (E) detection of labeled protein PKH67 by immunofluorescence assay. BMSC-exos: bone marrow MSC-derived exosomes. Three independent replications were performed.
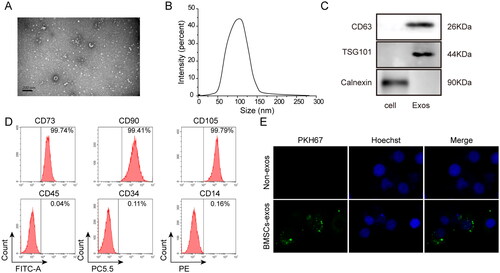
Figure 2. Effect of BMSC-exos on pyroptosis in HK-2 cells induced by HG. (A) The MTT assay was used to measure cell viability; (B) the LDH release assay was used to measure cytotoxicity; (C) IL-1β and IL-18 levels were measured by ELISA; (D) expression of miR-30e-5p measured by RT-qPCR; (E, F) pyroptosis levels were detected by flow cytometry; (G) IL-1β and IL-18 expression measured by qRT-PCR; (H, I) IL-1β, caspase-1, GSDMD-N, and NLRP3 expression measured by western blot analysis. Three independent replications were performed. *p<.05, **p<.01, and ***p<.001.
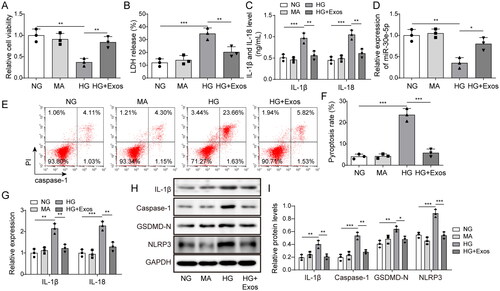
Figure 3. Effect of miR-30e-5p derived from BMSC-exos on pyroptosis. (A) The MTT assay was used to measure cell viability; (B) the LDH release assay was used to measure cytotoxicity; (C) IL-1β and IL-18 levels were measured by ELISA; (D, E) Pyroptosis levels as detected by flow cytometry; (F) IL-1β and IL-18 expression as measured by qRT-PCR; (G, H) IL-1β, caspase-1, GSDMD-N, and NLRP3 expression measured by western blot analysis. Three independent replications were performed. *p < .05, **p < .01, and ***p < .001.
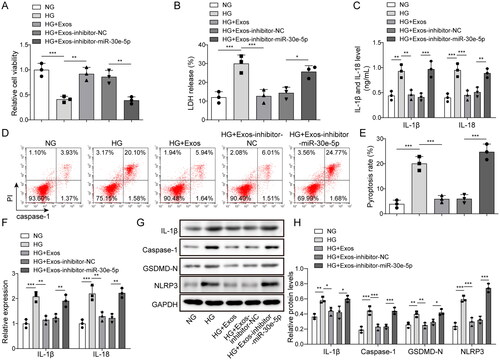
Figure 4. Effect of miR-30e-5p overexpression or ELVAL1 knockdown on HG-induced pyroptosis in HK-2 cells. (A) miR-30e-5p expression as measured by qRT-PCR; (B) ELVAL1 expression as measured by qRT-PCR; (C) the MTT assay was used to measure cell viability; (D) the LDH release assay was used to measure cytotoxicity; (E) IL-1β and IL-18 levels were measured by ELISA; (F, G) pyroptosis levels as detected by flow cytometry; (H) IL-1β and IL-18 expression as measured by qRT-PCR; (I, J) IL-1β, caspase-1, GSDMD-N, and NLRP3 expression as measured by western blot analysis. Three independent replications were performed. *p < .05, **p < .01, and ***p < .001.
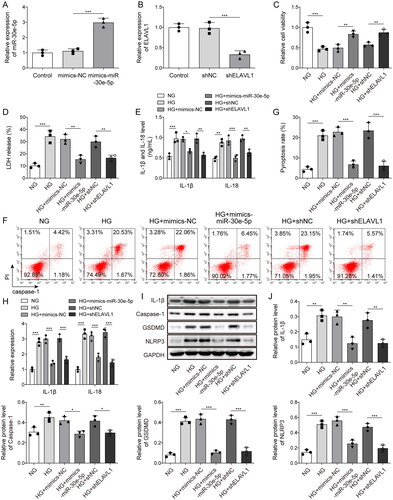
Figure 5. Targeting effect of miR-30e-5p and ELAVL1. (A) Binding site of miR-30e-5p and ELAVL1 predicted by starBase; (B) dual-luciferase reporter assay measuring the binding relationship between miR-30e-5p and ELAVL1; (C) MiR-30e-5p and ELAVL1 expression as measured by qRT-PCR; (D, E) expression of ELAVL1 as measured by western blot analysis. Three independent replications were performed. *p < .05, **p < .01, and ***p < .001.
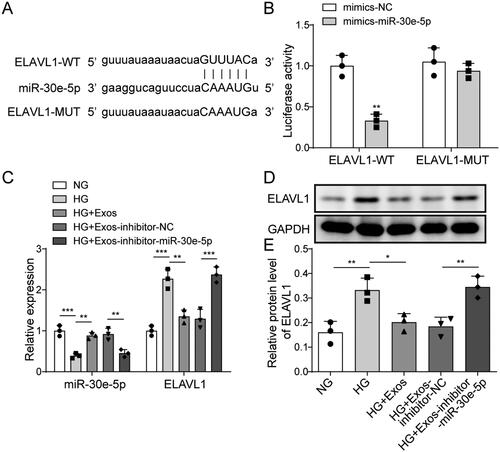
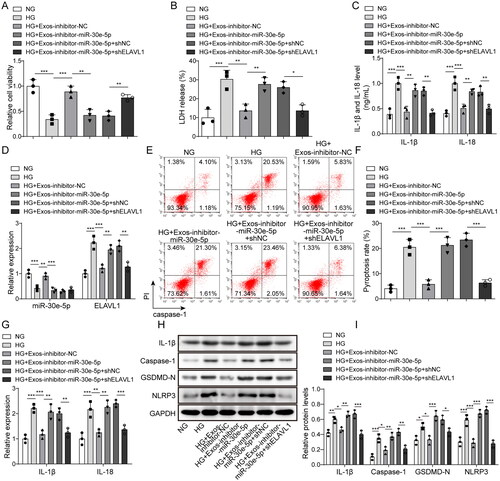
Figure 6. Effect of the miR-30e-5p/ELAVL1 axis on pyroptosis. (A) The MTT assay was used to measure cell viability; (B) the LDH release assay was used to measure cytotoxicity; (C) IL-1β and IL-18 levels were measured by ELISA; (D) expression of miR-30e-5p and ELAVL1 as measured by qRT-PCR; (E, F) pyroptosis levels as detected by flow cytometry; (G) IL-1β and IL-18 expression as measured by qRT-PCR; (H, I) IL-1β, caspase-1, GSDMD-N, and NLRP3 expression as measured by western blot analysis. Three independent replications were performed. *p < .05, **p < .01, and ***p < .001.