Figures & data
Figure 1. The protocol for selection of IgAN patients.
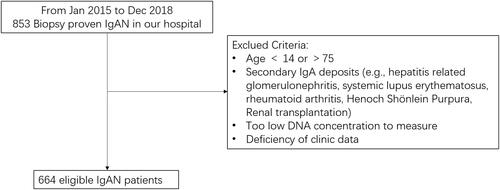
Table 1. Characteristics of patients with IgAN stratified by mtDNA-CN.
Figure 2. Correlations of mtDNA-CN in peripheral blood with renal function. Association between mtDNA-CN in peripheral blood and eGFR (A), SCr (B), BUN (C), UA (D), and proteinuria (E) were analyzed by Spearman’s rank correlation analysis. N = 664. eGFR: estimated glomerular filtration rate; mtDNA: mitochondrial DNA; CN: copy number. SD (with a mean of 0) as the unit of standardized determination for mtDNA-CN.
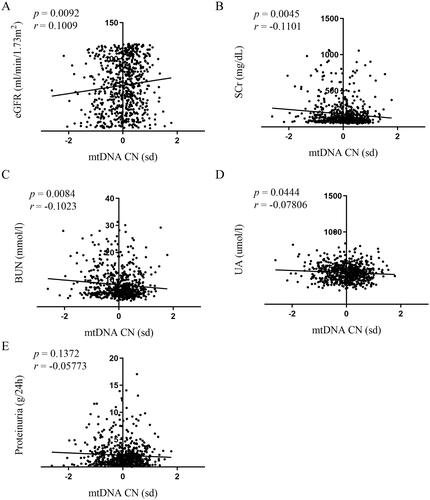
Figure 3. mtDNA-CN in patients with IgAN stratified by eGFR. Data were analyzed by Student’s t-test. mtDNA: mitochondrial DNA; CN: copy number. SD (with a mean of 0) as the unit of standardized determination for mtDNA-CN.
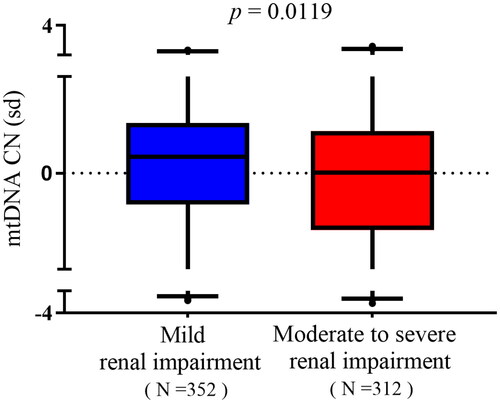
Table 2. mtDNA-CN characteristics of patients with IgAN stratified by eGFR.
Table 3. Multivariable logistic regression analyses of associations between mtDNA-CN and renal impairment.
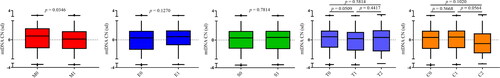
Figure 4. Relationships between mtDNA-CN and renal pathological changes in IgAN patients. Data were analyzed by Student’s t-test. SD (with a mean of 0) as the unit of standardized determination for mtDNA-CN. N = 615. Forty-nine individuals were excluded due to incomplete pathological Oxford classification information. Renal pathological changes were scored by professional pathologists referring to Oxford MEST-C Classification. Patients were scored M0 or M1 in terms of mesangial hypercellularity: when >50% of glomeruli showing four or more cells in one or more mesangial area, not including central core and region of the vascular pole were scored M1. E score or S score were defined as absent (0) or present (1) of endocapillary hypercellularity (E) or segmental glomerulosclerosis (S). T score was defined in terms of estimated percentage of interstitial fibrosis and tubular atrophy: T0 (≤25%), T1 (26–50%), and T2 (>50%). C score referred to crescents: C0 (0%), C1 (0% to <25%), and C2 (>25%).