
Figures & data
Table 1. Baseline DPI, nutritional parameters and dialysis adequacy of 668 PD patients.
Table 2. Univariate and multivariate Cox regression analysis of the impact of baseline data on mortality.
Figure 1. The Kaplan–Meier survival curves in PD patients according to the baseline DPI level. PD: peritoneal dialysis; DPI: dietary protein intake.
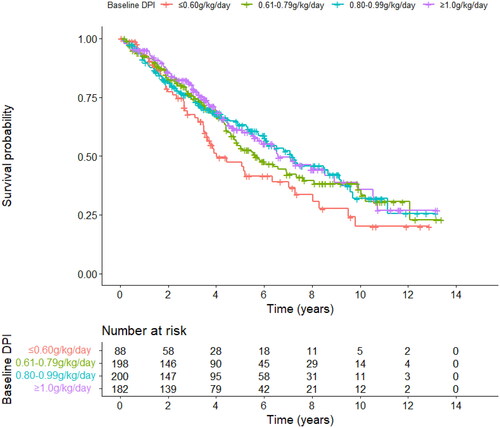
Figure 2. Grouping of time-dependent DPI in PD patients. Red, the consistently median DPI group (0.80–0.99 g/kg/day, n = 253); Green, the consistently low DPI group (0.61–0.79 g/kg/day, n = 154); Blue, the high DPI group (≥1.0 g/kg/day, n = 45). PD: peritoneal dialysis; DPI: dietary protein intake.
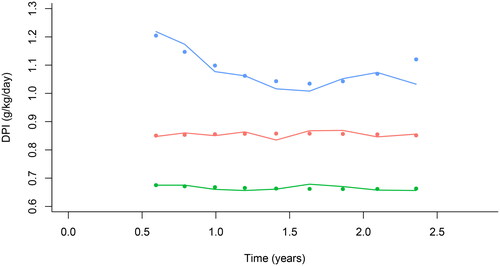
Table 3. Baseline characteristics of PD patients according to longitudinal DPI latent classes.
Table 4. Associations between baseline characteristics and being in latent classes for DPI levels using logistic regression model.
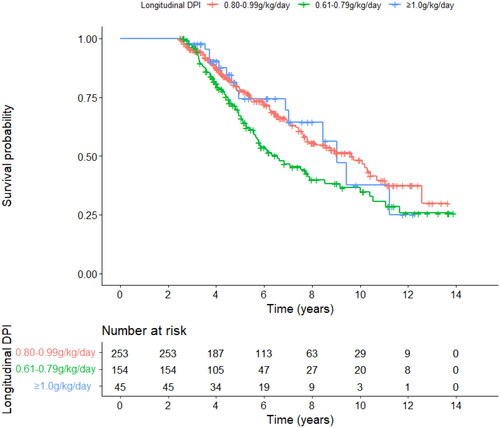
Figure 3. The Kaplan-Meier survival curves in PD patients according to the grouping of time-dependent DPI. PD, peritoneal dialysis; DPI, dietary protein intake.
Supplemental Material
Download PDF (92.8 KB)Supplemental Material
Download PDF (106.8 KB)Data availability statement
Data are not available due to the property rights of the healthcare center that has collected these data. Chunyan Su could be contacted if someone wants to request the data.