
Figures & data
Figure 1. TGs protect kidneys against doxorubicin-mediated injury. (A) 24 h Urine protein-to-creatinine ratio (PCR). (B) Blood urea nitrogen. (C) Serum creatinine concentration. (D) Kidney index. (E) Serum TG levels in rats (n = 5–6). (F) Serum TC levels in rats (n = 5–6). (G) Body weight (n= 5–6 per group). (H) Serum albumin (n= 5–6 per group). Significance between groups was determined by ANOVA followed by Dunnett’s T3. Model group vs. Control group (*p ≤ 0.05 and **p ≤ 0.01); TGs group and Prednisone group vs. Model group (#p ≤ 0.05, ##p ≤ 0.01, and NS p > 0.05); TGs group vs. Prednisone group ($$p ≤ 0.01 and NS p > 0.05).
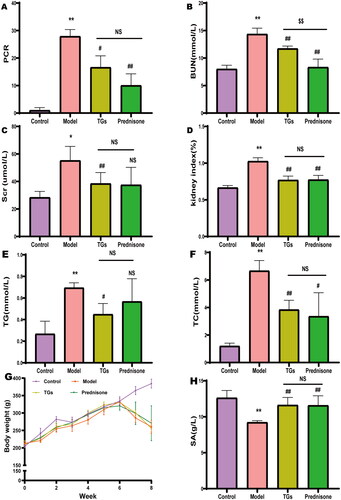
Figure 2. TGs protect against alterations in the kidney architecture of NS. HE staining (n = 3; scale bar: 50 µm). Yellow arrows indicate brush border detachment and absence. Blue arrows indicate protein casts. Yellow triangles indicate focal inflammatory cell infiltration.
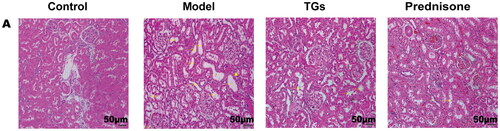
Figure 3. TGs alleviate abnormal lipids in NS. (A) Oil Red O and hematoxylin staining of kidney sections (n = 3; scale bar: 50 µm). (B–D) Expression of CD36 and ADFP in renal tissues (n = 3). Significance between groups was determined by ANOVA followed by Tukey. Model group vs. Control group (**p ≤ 0.01); TGs group or Prednisone group vs. Model group (#p ≤ 0.05 and ##p ≤ 0.01); TGs group vs. Prednisone group (NS p > 0.05).
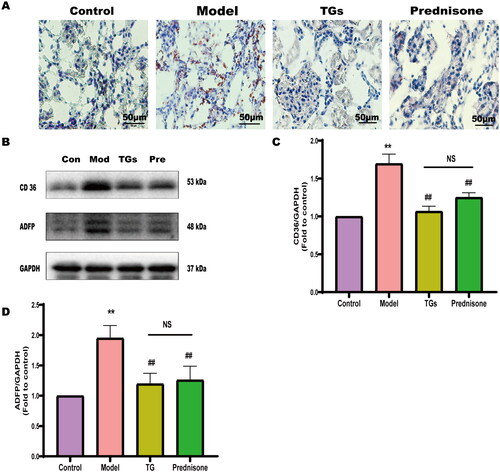
Figure 4. TGs inhibit renal oxidative stress in NS. (A) Levels of GSH in renal tissue homogenate. (B) Levels of MDA in renal tissue homogenate. (n = 5–6). Significance between groups was determined by ANOVA followed by Dunnett’s T3. Model group vs. Control group (**p ≤ 0.01, and NS p > 0.05); TGs group or Prednisone group vs. Model group (#p ≤ 0.05 and ##p ≤ 0.01); TGs group vs. prednisone group (NS p > 0.05).
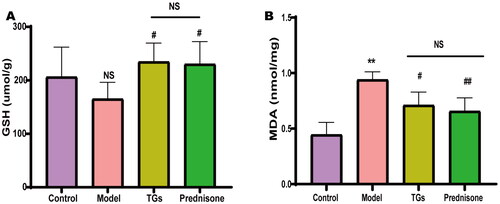
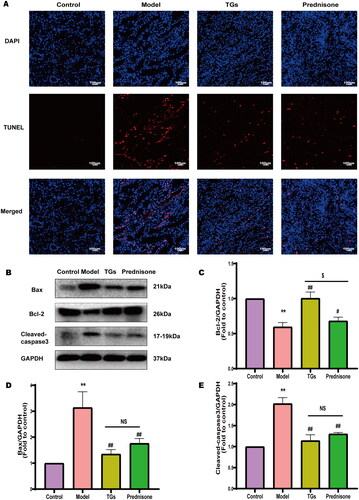
Figure 5. TGs inhibit renal apoptosis of NS. (A) TUNEL and DAPI staining of kidney sections (n = 3; scale bar: 100 µm). (B–E) Bax, Bcl-2, and Cleaved caspase-3 expression in the kidney (n = 3). Significance between groups was determined by ANOVA followed by Tukey. Model group vs. Control group (**p ≤ 0.01); TGs group or Prednisone group vs. Model group (#p ≤ 0.05 and ##p ≤ 0.01); TGs group vs. prednisone group ($p ≤ 0.05, and NS p > 0.05).
Supplemental Material
Download PDF (390.8 KB)Data availability statement
All data generated during the study can be obtained upon reasonable request from the corresponding author.