Figures & data
Figure 1. Effects of metformin combined with gallic acid treatment on body weight (A) and fasting blood glucose levels (B) in mice model of diabetic nephropathy. All mice had free access to food and water at all times. Fasting blood glucose levels and body weight were measured once a week. 10 mice were used for each group. Data are presented as mean ± SD. ###p < 0.001 compared to normal. *p < 0.05, **p < 0.01 compared to vehicle. ^p < 0.05 compared to MET group.
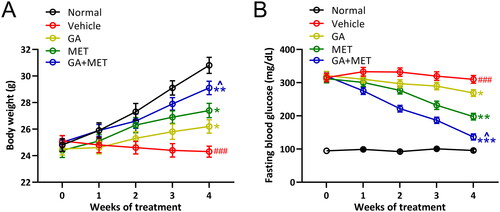
Figure 2. Effects of metformin combined with gallic acid treatment on kidney/body weight (A), Urea (B), BUN (C) and Creatinine (D) in serum of mice model of diabetic kidney disease at the end of 4 weeks treatment. Serum levels of blood urea nitrogen (BUN), urea, and creatinine (Cr) were analyzed by an automatic analyzer (cobas® 8000 modular analyzer series. Roche Diagnostics). 10 mice were used for each group. Data are presented as mean ± SD. ###p < 0.001 compared to normal. *p < 0.05, **p < 0.01, ***p < 0.001 compared to vehicle. ^p < 0.05, ^^p < 0.01 compared to MET group.
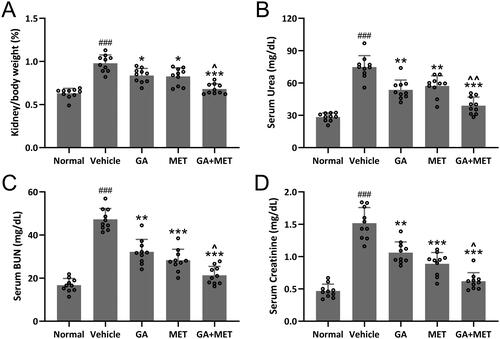
Figure 3. Effects of metformin combined with gallic acid treatment on urine volume (A), urine albumin (B), total proteins (C) and Creatinine clearance (D) in urine of mice model of diabetic kidney disease at the end of 4 weeks treatment. Urinary levels of albumin, total proteins, and creatinine were analyzed by an automatic analyzer (cobas® 8000 modular analyzer series. Roche Diagnostics). 10 mice were used for each group. Data are presented as mean ± SD. ###p < 0.001 compared to normal. *p < 0.05, **p < 0.01, ***p < 0.001 compared to vehicle. ^p < 0.05, ^^p < 0.01 compared to MET group.
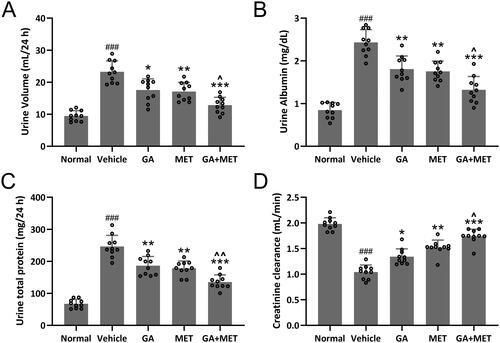
Figure 4. Effects of metformin combined with gallic acid treatment on histopathological change of the kidney at the end of 4 weeks treatment. (A) Representative HE staining among different groups and the quantification of histological score (B). The data were gotten from six mice in each group and the data point indicates the average of single mouse from eight random fields. (C) Representative Periodic Acid Schiff (PAS) staining among different groups and the quantification of mesangial matrix index (D). The data were gotten from six mice in each group and the data point indicates the average of single mouse from 10 random fields. Data are presented as mean ± SD. ###p < 0.001 compared to normal. *p < 0.05, **p < 0.01, ***p < 0.001 compared to vehicle. ^p < 0.05, ^^p < 0.01 compared to MET group.
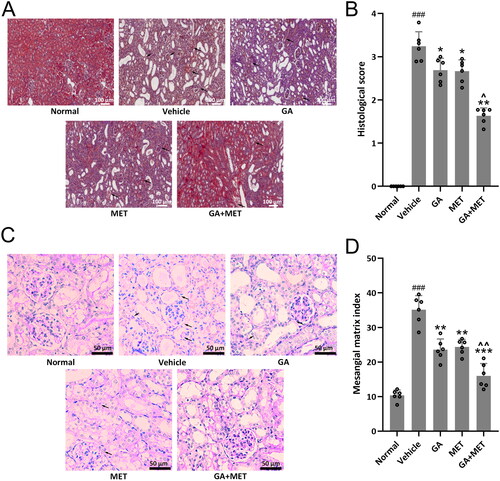
Figure 5. Effects of metformin combined with gallic acid treatment on renal oxidative stresses in mice model of diabetic kidney disease at the end of 4 weeks treatment. (A) Representative images of dihydroethidium (DHE) staining for the assessment of superoxide production and (B) bar diagram showing the percent of DHE fluorescence intensity. The data were gotten from six mice in each group and the data point indicates the average of single mouse from eight random fields. The levels of MDA (C), SOD (D), GSH (E) and CAT (F) in renal tissues were measured. Eight mice were used for each group. Data are presented as mean ± SD. ##p < 0.01, ###p < 0.001 compared to normal. *p < 0.05, **p < 0.01, ***p < 0.001 compared to vehicle. ^p < 0.05, ^^p < 0.01 compared to MET group.
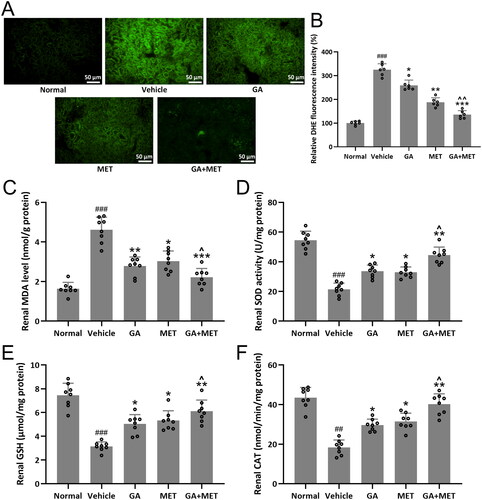
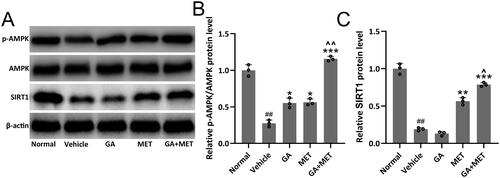
Figure 6. Effects of metformin combined with gallic acid treatment on renal AMPK/SIRT1 signaling pathway in mice model of diabetic nephropathy. Western blotting was used to measure the protein expressions of p-AMPK, AMPK and SIRT1 (A) and the relative expressions were normalized to normal (B and C). β-actin was used as a loading control. The data were gotten from three repeated experiments using renal homogenate from each group including eight mice. Data are presented as mean ± SD. ##p < 0.01, ###p < 0.001 compared to normal. *p < 0.05, **p < 0.01, ***p < 0.001 compared to vehicle. ^p < 0.05 compared to MET group.