Figures & data
Figure 1. HYAL1 knockdown alleviated renal dysfunction in LPS mice. (A) Survival rates of mice in Sham + LV-NC, Sham + LV-sh-HYAL1, LPS + LV-NC and LPS + LV-sh-HYAL1 groups. (B, C) ELISA for measuring the levels of serum BUN and SCr in Sham + LV-NC, Sham + LV-sh-HYAL1, LPS + LV-NC and LPS + LV-sh-HYAL1 groups. (D, E) ELISA for measuring the levels of NGAL and KIM-1 in urine of mice in Sham + LV-NC, Sham + LV-sh-HYAL1, LPS + LV-NC and LPS + LV-sh-HYAL1 groups. N = 10 mice each group. ***p < .001 vs. Sham + LV-NC group; ##p < .01 vs. LPS + LV-NC group.
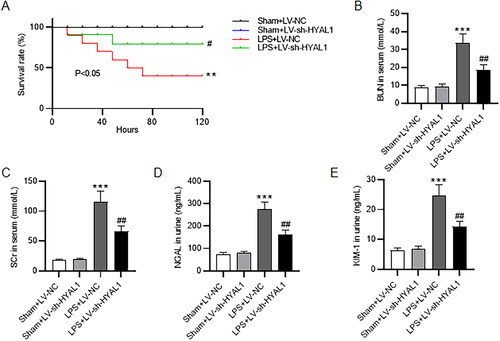
Figure 2. HYAL1 depletion alleviated renal injury of LPS-induced AKI mice. (A) HE staining for renal histological changes in Sham + LV-NC, Sham + LV-sh-HYAL1, LPS + LV-NC and LPS + LV-sh-HYAL1 groups (scale bar = 50 μm). 200×. Black arrow presents inflammatory cellular infiltration in the renal interstitium. Red arrow presents severe granular in renal tubular epithelial cells, vacuolar degeneration, and renal tubular necrosis. (B) Tubular injury scores in Sham + LV-NC, Sham + LV-sh-HYAL1, LPS + LV-NC and LPS + LV-sh-HYAL1 groups. (C, D) TUNEL assay for apoptotic cells in renal tissues of mice in Sham + LV-NC, Sham + LV-sh-HYAL1, LPS + LV-NC and LPS + LV-sh-HYAL1 groups (scale bar = 100 μm). N = 10 mice each group. ***p < .001 vs. Sham + LV-NC group; ##p < .01 vs. LPS + LV-NC group.
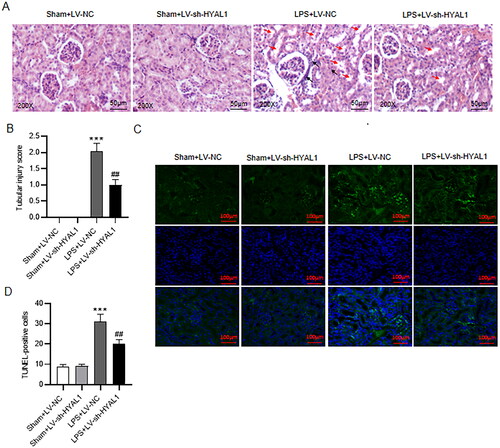
Figure 3. HYAL1 deficiency inhibited oxidative stress and inflammatory response in LPS-induced AKI mice. (A, B) ELISA assay for determining MDA and SOD levels in renal tissues of mice in Sham + LV-NC, Sham + LV-sh-HYAL1, LPS + LV-NC and LPS + LV-sh-HYAL1 groups. (C) RT-qPCR for iNOS mRNA level in renal tissues of mice in Sham + LV-NC, Sham + LV-sh-HYAL1, LPS + LV-NC and LPS + LV-sh-HYAL1 groups. (D) Representative fluorescent images of DHE staining (scale bar = 100 μm). (E) The quantification of the DHE fluorescence intensity. (F–H) ELISA for serum TNF-a, IL-6, and IL-1β levels in Sham + LV-NC, Sham + LV-sh-HYAL1, LPS + LV-NC and LPS + LV-sh-HYAL1 groups. N = 10 mice each group. **p < .01, ***p < .001 vs. Sham + LV-NC group; #p < .05, ##p < .01 vs. LPS + LV-NC group.
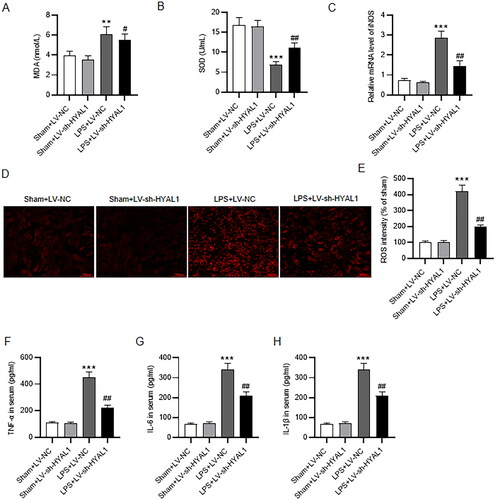
Figure 4. HYAL1 knockdown protected endothelial glycocalyx in LPS-induced AKI mice. (A) Western blotting for syndecan-1 and heparanase-1 protein levels in murine kidneys of Sham + LV-NC, Sham + LV-sh-HYAL1, LPS + LV-NC and LPS + LV-sh-HYAL1 groups. (B) ELISA for hyaluronidase activity in murine serum of Sham + LV-NC, Sham + LV-sh-HYAL1, LPS + LV-NC and LPS + LV-sh-HYAL1 groups. (C, D) ELISA for hyaluronic acid level in murine serum and urine of Sham + LV-NC, Sham + LV-sh-HYAL1, LPS + LV-NC and LPS + LV-sh-HYAL1 groups. (E) Immunofluorescence staining for hyaluronic acid level in murine renal endothelial glycocalyx of Sham + LV-NC, Sham + LV-sh-HYAL1, LPS + LV-NC and LPS + LV-sh-HYAL1 groups (scale bar = 20 μm). (F) The quantification of the hyaluronic acid fluorescence intensity. (G, H) IHC staining for hyaluronic acid level within tubulointerstitial (scale bar = 50 μm). N = 10 mice each group. **p < .01, ***p < .001 vs. Sham + LV-NC group; #p < .05, ##p < .01 vs. LPS + LV-NC group.
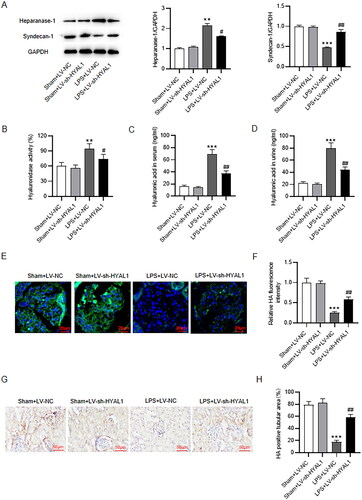
Figure 5. HYAL1 silencing regulated AMPK/mTOP signaling in LPS-induced AKI mice. (A) Western blotting for the protein levels of p-AMPK, AMPK, p-mTOR and mTOR in murine renal tissues of Sham + LV-NC, Sham + LV-sh-HYAL1, LPS + LV-NC and LPS + LV-sh-HYAL1 group. N = 10 mice each group. ***p < .001 vs. Sham + LV-NC group; ##p < .01 vs. LPS + LV-NC group.
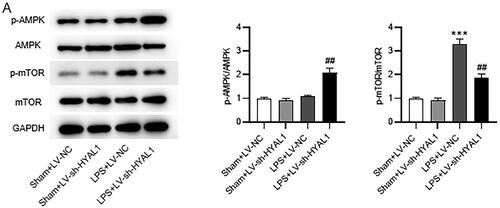
Figure 6. HYAL1 deficiency induced autophagy in LPS-induced AKI mice. (A) Western blotting for the protein levels of LC3‑II/I and p62 in murine renal tissues of Sham + LV-NC, Sham + LV-sh-HYAL1, LPS + LV-NC and LPS + LV-sh-HYAL1 groups. N = 10 mice each group. ***p < .001 vs. Sham + LV-NC group; ##p < .01 vs. LPS + LV-NC group.
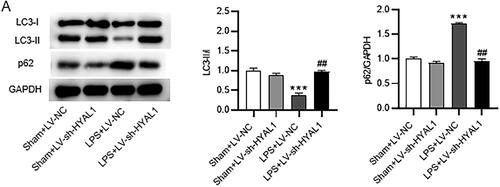
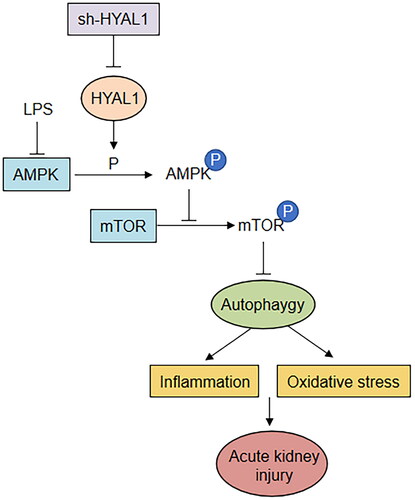
Figure 7. A schematic presentation of the whole research finding. Sepsis-induced AKI is established by intraperitoneally injecting LPS (10 mg/kg) into mice. HYAL1 knockdown enhances autophagy through the AMPK/mTOR pathway to inhibit inflammation and oxidative stress and protect the kidney.