2,147
Views
3
CrossRef citations to date
0
Altmetric
State-of-the-Art Review

The intellectual base and global trends in contrast-induced acute kidney injury: a bibliometric analysis

, , , , , , & show all
Article: 2188967 | Received 05 Dec 2022, Accepted 03 Mar 2023, Published online: 17 Mar 2023

Figures & data

Figure 1. Global characteristics of articles published on CI-AKI. (A) Number of articles issued per year. (B) Number of articles published by country/region. (C) Type of article and corresponding number of publications. (D) WoS catalog classification of research areas. (E) Funding status of the article. (F) The publisher of the article.

Figure 1. Global characteristics of articles published on CI-AKI. (A) Number of articles issued per year. (B) Number of articles published by country/region. (C) Type of article and corresponding number of publications. (D) WoS catalog classification of research areas. (E) Funding status of the article. (F) The publisher of the article.

Figure 2. Flowchart of the screening process.

Figure 2. Flowchart of the screening process.

Figure 3. A network of national/regional and institutional cooperation in the field of CI-AKI. (A) The collaboration network of countries/regions. (B) The collaboration network of institutions.

Figure 3. A network of national/regional and institutional cooperation in the field of CI-AKI. (A) The collaboration network of countries/regions. (B) The collaboration network of institutions.

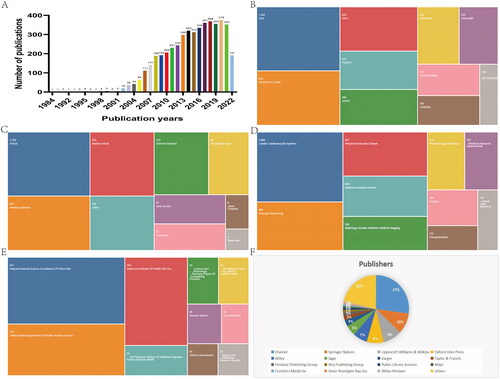
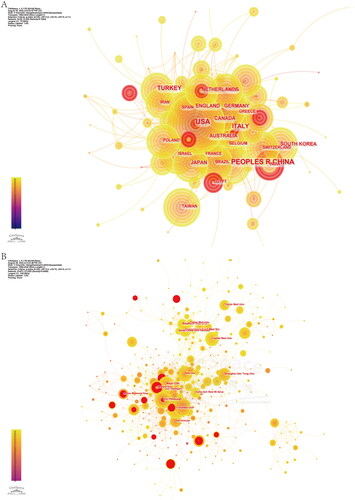
Table 1. The top 10 countries/regions and institutions involved in CI-AKI.

Figure 4. Visual analysis of journals. (A) The network of article source journals. (B) The network of cocited journals.

Figure 4. Visual analysis of journals. (A) The network of article source journals. (B) The network of cocited journals.

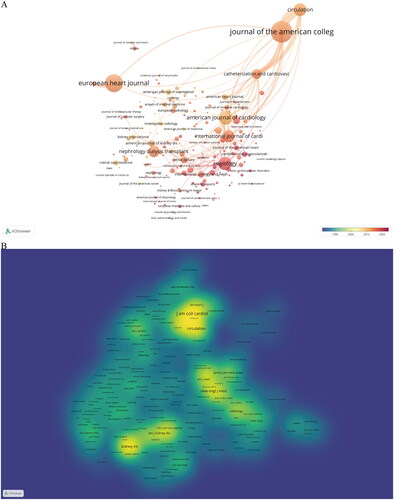
Table 2. The top 10 journals and cocited journals related to CI-AKI.

Figure 5. The dual-map overlay of journals.

Figure 5. The dual-map overlay of journals.

Figure 6. Visual analysis of authors. (A) The collaboration network of scholars. (B) The network of cocited authors.

Figure 6. Visual analysis of authors. (A) The collaboration network of scholars. (B) The network of cocited authors.

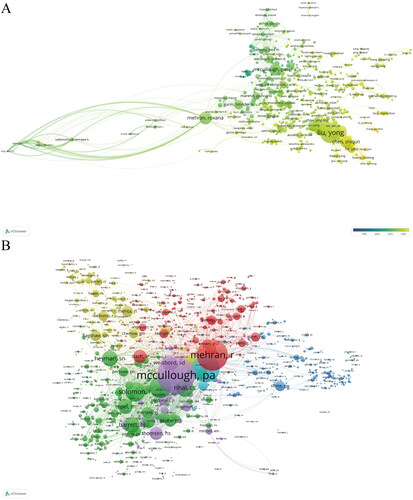
Table 3. The top 10 authors and cocited authors of CI-AKI research.

Table 4. The top 10 articles on CI-AKI.

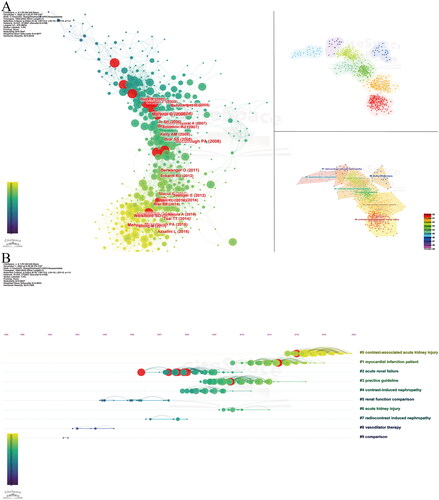
Table 5. The top 10 cocited references of CI-AKI research.

Figure 7. Visual analysis of cocited references. (A) Cluster analysis of cocited references. (B) The clustering timeline map of cocited references.

Figure 7. Visual analysis of cocited references. (A) Cluster analysis of cocited references. (B) The clustering timeline map of cocited references.

Table 6. The top 10 clusters of cocited references.

Figure 8. Visual analysis of keywords. (A) Heat map of keywords. (B) Cluster analysis of keywords. (C) The clustering timeline map of keywords.

Figure 8. Visual analysis of keywords. (A) Heat map of keywords. (B) Cluster analysis of keywords. (C) The clustering timeline map of keywords.

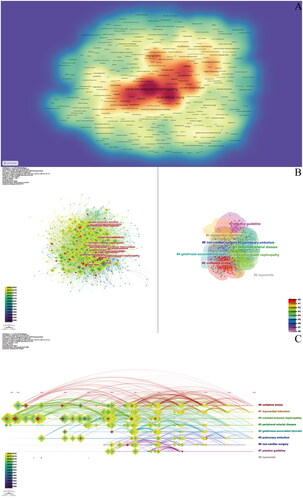
Table 7. The top 20 keywords of CI-AKI research.

Supplemental material

Supplemental Material

Download JPEG Image (205.2 KB)

Supplemental Material

Download TIFF Image (2.9 MB)

Supplemental Material

Download TIFF Image (14.9 MB)