
Figures & data
Table 1. Demographic and biochemical data of the patients.
Figure 1. Typical base peak chromatograms of the two groups. Typical base peak chromatograms of the representative serum sample from the EDS patients in positive (A) and negative (B) ion modes; the non-EDS patients in positive (C) and negative (D) ion modes. In positive and negative ion modes, the peaks and retention times between the groups were relatively similar. Small differences among time, peak height, and low energy observed intuitively indicate differences in metabolites across concentration and type dimensions.
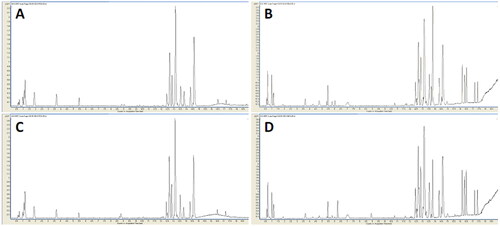
Figure 2. The PLS-DA score plot showed a global metabolic difference between the two groups. Score plots derived from PLS-DA in classifying PD patients with and without EDS in positive (A) and negative (C) ion modes, a clear separation trend between the two groups indicates that the plasma metabolic profile has changed significantly. Validation plots of the PLS-DA model in positive (B) and negative (D) ion modes.
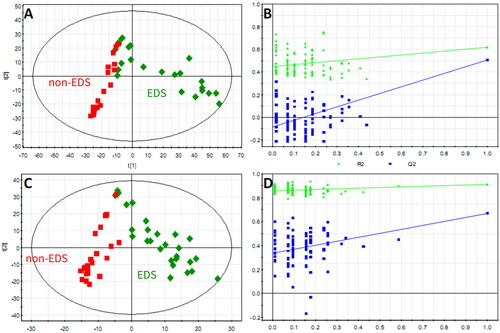
Table 2. Differential serum metabolites identified for the EDS and non-EDS groups.
Figure 3. Venn diagram of the protein sets between metabolites and EDS.
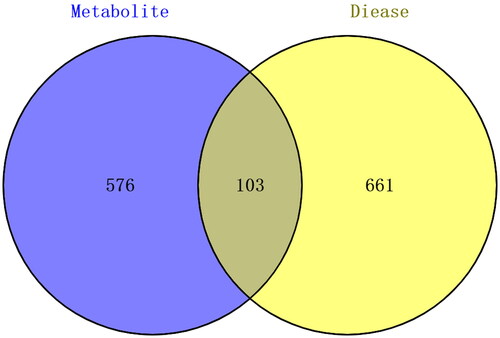
Figure 4. EDS–metabolite–target protein network construction. Cytoscape software was used to build the EDS–metabolite–target protein network. The central region represents EDS; only 8 metabolites (green nodes) had metabolite targets (103 yellow nodes).
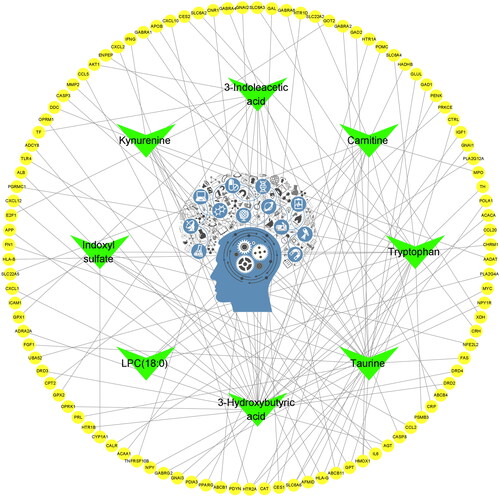
Figure 5. PPI network of the overlapping target proteins. (A) PPI network of the 103 overlapping target proteins; (B) PPI network of the critical targets according to the criterion of degree value greater than 20; (C) PPI network of the 14 critical targets according to the node degree (in B and C, the size and color saturation of the node are proportional to its significance).
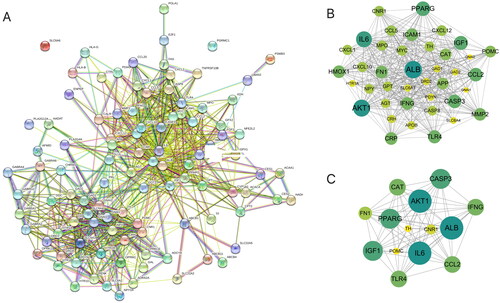
Figure 6. GO and KEGG pathway enrichment analysis of the overlapping target proteins. (A) The top 10 pathways in the KEGG pathway analysis of the overlapping target proteins; (B) The top 10 biological process terms in the GO enrichment analysis of the overlapping target proteins.
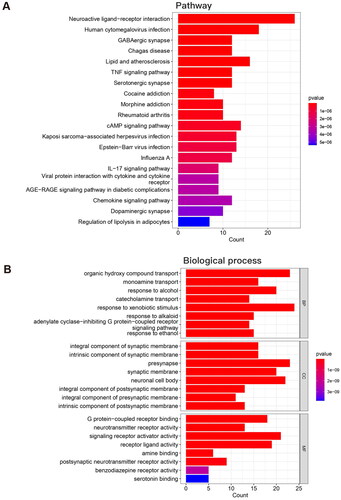
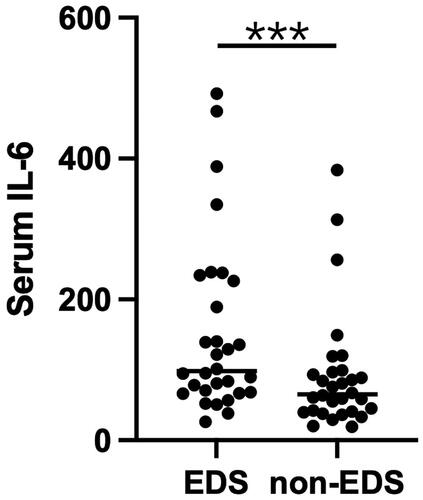
Figure 7. Scatter plot of serum IL-6 levels in the EDS and non-EDS groups. ***P < 0.0001.
Supplemental Material
Download PDF (2.1 MB)Supplemental Material
Download PDF (254.5 KB)Supplemental Material
Download PDF (108.8 KB)Supplemental Material
Download PDF (634.2 KB)Supplemental Material
Download PDF (414.5 KB)Data availability statement
The data presented in this study are available in supplementary materials.