
Figures & data
Figure 1. Flowchart showing the procedure for the selection of study participants. PTA: percutaneous transluminal angioplasty; AVF: arteriovenous fistula.
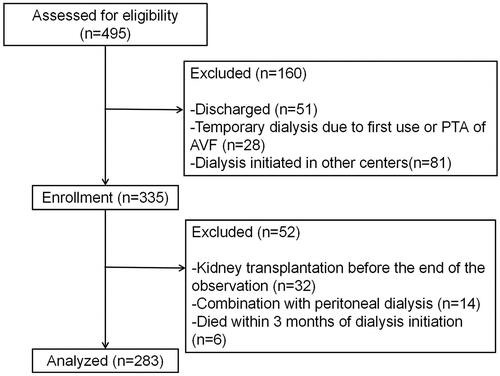
Figure 2. Schematic diagram of patient adaptation, visit-to-visit observation, and follow-up after dialysis.
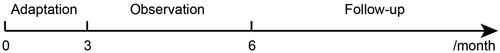
Table 1. The general clinical characteristics of the included participants.
Figure 3. Survival comparing according to UVSD (A) or UVCV (B) between higher and lower groups using the Kaplan–Meier method.
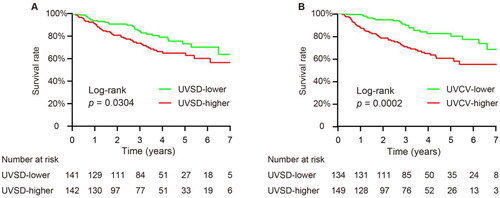
Figure 4. Multivariate analysis using the Cox proportional hazard regression analyses. All-cause mortality risk analysis according to the UVSD (A) or UVCV (B); adjusted for age, CVD, diabetes, vascular access, CKD etiology, hemoglobin, serum albumin, serum P, and serum iPTH.
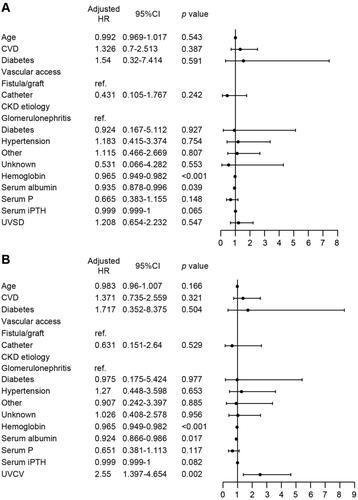
Table 2. Univariate analysis of the associations between variables and all-cause mortality using Cox proportional hazard regression analyses.
Figure 5. Subgroup analysis according to age, gender, with or without comorbidities. All-cause mortality risk analysis according to UVSD (A) or UVCV (B); adjusted for age, CVD, diabetes, vascular access, CKD etiology, hemoglobin, serum albumin, serum P, and serum iPTH.
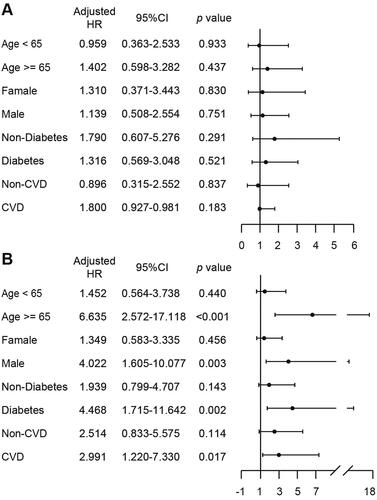
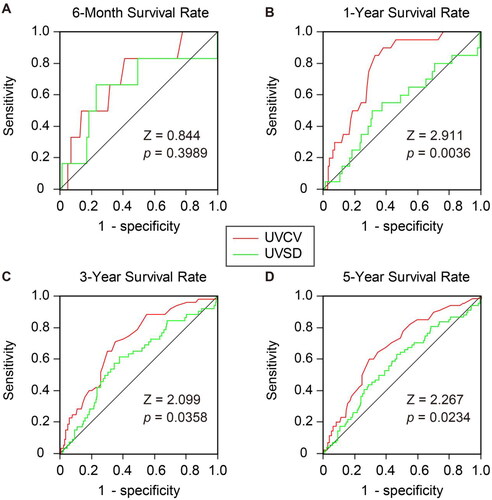
Figure 6. Comparison of the area under the curve (AUC) between UVSD (green) and UVCV (red) in predicting 6-month (A), 1-year (B), 3-year (C) and 5-year (D) survival rate. The significances of ROC AUC between UVCV and UVSD were tested by Z test.
Data availability statement
The data that support the findings of this study are not publicly available due to their containing information that could compromise the privacy of research participants but are available from the corresponding author.