
Figures & data
Figure 1. Ultrasound images of different groups show the difference in diameter between the anterior and posterior renal pelvis.ALandAR: left and right kidneys in the sham group; there was no obvious hydronephrosis in the renal pelvis. BLandBR: left and right kidneys in the sham + ABT-263 (50 mg/kg) group; there was no notable hydronephrosis in the renal pelvis. CLandCR: left and right kidneys in the neurogenic bladder fibrosis (NBF) group andhydronephrosis in the renal pelvis. DLandDR: left and right kidneys in the NBF + ABT-263 group (25 mg/kg); compared with the NBF group, hydronephrosis in the renal pelvis was significantly reduced. ELandER: left and right kidneys in the NBF + ABT-263 group (50 mg/kg). Compared with the NBF + ABT-263 group (25 mg/kg), hydronephrosis in the renal pelvis was significantly reduced. The yellow arrow indicates the hydronephrosis area. f: Statistical histograms of the anterior and posterior diameters of the renal pelvis (the anterior and posterior diameters of the left and right kidneys were added together and then averaged); gandh: Statistical histograms of serum creatinine (SC) and blood urea nitrogen (BUN) levels. Data are expressed as the mean ± SEM; ns p > 0.5, *p < 0.01, **p < 0. 001. All experiments were repeated three times.
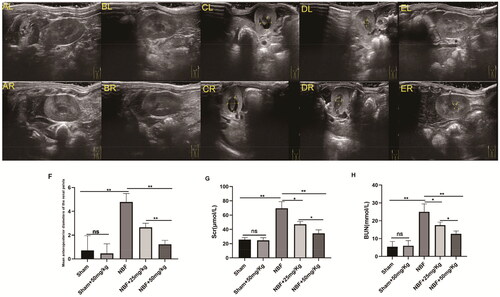
Figure 2. Staining of kidney tissue sections in each group.a1–e1 represent the general condition of the kidneys in the sham group, sham + ABT-263 group (50 mg/kg), NBF group, NBF + ABT-263 group (25 mg/kg), and NBF + ABT-263 group (50 mg/kg). a2–e2 represents the hematoxylin and eosin (HE) staining of the kidneys in each group. a3–e3 represent Masson staining of kidneys in each group. The kidneys in the sham and sham + ABT-263 group (50 mg/kg) groups were basically normal. The kidney damage and fibrosis in the NBF group were the most serious, followed by those in the NBF + ABT-263 group (25 mg/kg), and the kidney damage and fibrosis in the NBF + ABT-263 group (50 mg/kg) were greatly improved. f: Statistical histogram of renal HE staining scores in each group. g: Statistical histogram of renal Masson staining scores in each group. HE Scalebar = 50 μm. Masson Scale bar = 50 μm. Data are expressed as the mean ± SEM; ns p > 0.5, *p < 0.01, **p < 0.001, ***p < 0. 0001. All experiments were repeated three times.
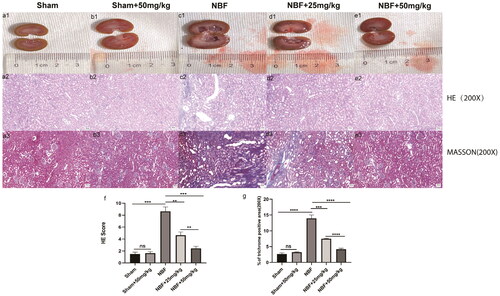
Figure 3. Cystometry in each group. (a) Representative bladder pressure curve of the sham group showing regular micturition. (b) Representative bladder pressure curve of the sham + ABT-263 (50 mg/kg) group showing regular micturition contractions. (c) The representative bladder pressure curve of the NBF group showing no micturition contraction when the intravesical pressure increased to reach the Pves.leak, and the rats experienced overflow incontinence. (d) Representative bladder pressure curve of the NBF + ABT-263 (25 mg/kg) group showing no micturition contraction when the intravesical pressure was increased to reach the Pves.leak. The rats experienced overflow incontinence, but their bladder volume was significantly larger than that in the NBF group. e: Representative bladder pressure curve of the NBF + ABT-263 (50 mg/kg) group showing no micturition contraction when the intravesical pressure was increased to reach the Pves.leak. The rats experienced overflow incontinence, but the bladder volume was significantly larger than that in the NBF + ABT-263 (25 mg/kg) group. f: The bladder volume (BV) of the NBF group was significantly higher than that of the sham group, while the BV of the NBF + ABT-263 (25 mg/kg) and NBF + ABT-263 (50 mg/kg) groups were significantly higher than that of the NBF group. Moreover, the BV of the NBF + ABT-263 (50 mg/kg) group was significantly higher than that of the NBF + ABT-263 (25 mg/kg) group. g: △p (= Pves.leak–Pves.bas) of the NBF group was significantly higher than that of the △p(=Pves.thre–Pves.bas) sham group, while the △p (= Pves.leak–Pves.bas) of the NBF + ABT-263 (25 mg/kg) and NBF + ABT-263 (50 mg/kg) groups were significantly lower than that of the NBF group. Moreover, △p of the NBF + ABT-263 (50 mg/kg) group was significantly lower than that of the NBF + ABT-263 (25 mg/kg) group. h: The bladder compliance (BC) of the NBF group was significantly lower than that of the sham group, while the BC of the NBF + ABT-263 (25 mg/kg) and NBF + ABT-263 (50 mg/kg) groups was significantly higher than that of the NBF group. Moreover, the BC content of the NBF + ABT-263 (50 mg/kg) group was significantly higher than that of the NBF + ABT-263 (25 mg/kg) group. Data are expressed as the mean ± SEM; *p < 0.01, **p < 0.001, ***p < 0. 0001. All experiments were repeated three times.
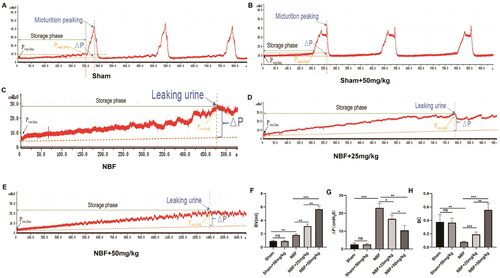
Figure 4. Staining of bladder tissue sections in each group. (a1–e1) represent the general condition of the bladder in the sham group, sham + ABT-263 group (50 mg/kg), NBF group, NBF + ABT-263 group (25 mg/kg), and NBF + ABT-263 group (50 mg/kg), respectively. (a2–e2) represents the matoxylin and eosin (HE) staining of the bladder in each group. (a3–e3) represent Masson staining of each bladder. a4–e4 represents Sirius red staining of the bladder in each group. (f) Statistical histogram of bladder weight in each group, which shows that bladder fibrosis was basically normal in the sham group and sham + ABT-263 group (50 mg/kg), the most serious in the NBF group, slightly improved in the NBF + ABT-263 group (25 mg/kg), and greatly improved in the NBF + ABT-263 group (50 mg/kg). (g) Statistics of the bladder HE staining score in each group histogram, which showed that bladder inflammation was basically normal in the sham and sham + ABT-263 (50 mg/kg) groups, the most serious in the NBF group, slightly improved in the NBF + ABT-263 group (25 mg/kg), and greatly improved in the NBF + ABT-263 group (50 mg/kg). (h) Statistical histogram of bladder fibrosis area in each group, which shows that bladder fibrosis was basically normal in the sham and sham + ABT-263 (50 mg/kg) groups, the most serious in the NBF group, slightly improved in the NBF + ABT-263 group (25 mg/kg), and greatly improved in the NBF + ABT-263 group (50 mg/kg). j: Statistical histogram of the Col3/Col1 ratios for each group. HE Scale bar = 200 μm. Masson Scale bar = 50 μm. Sirius red Scalebar = 100 μm. Data are expressed as the mean ± SEM; ns p > 0.5, *p < 0.01, **p < 0.001, ***p < 0. 0001. All experiments were repeated three times.
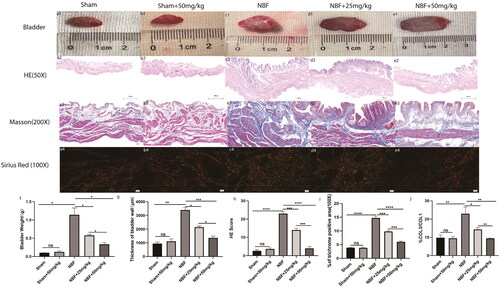
Figure 5. WB and qPCR results of col1, col3, and FN in the bladder tissues of different groups. (a–c) Statistical histogram of the relative ratio of col1, col3, and Fn mRNA in bladder tissue in the sham, sham + ABT-263 (50 mg/kg), NBF group, NBF + ABT-263 (25 mg/kg), NBF + ABT-263 (50 mg/kg) groups; d: WB in bladder tissue in sham, sham + ABT-263 (50 mg/kg), NBF, NBF + ABT-263 (25 mg/kg), and NBF + ABT-263 (50 mg/kg) groups, with GADPH as the internal reference protein. (e–g) Relative expression of col1, col3, and FN protein in bladder tissue in sham, sham + ABT-263 (50 mg/kg), NBF, NBF + ABT-263 (25 mg/kg), and NBF + ABT-263 (50 mg/kg) groups. The histogram of ratio statistics shows that bladder fibrosis were basically normal in the sham and sham + ABT-263 (50 mg/kg) groups, the most serious in the NBF group, slightly improved in the NBF + ABT-263 group (25 mg/kg), and greatly improved in the NBF + ABT-263 group (50 mg/kg). Data are expressed as the mean ± SEM; ns p > 0.5, *p < 0.01, **p < 0.001, ***p < 0.0001. All experiments were repeated three times.
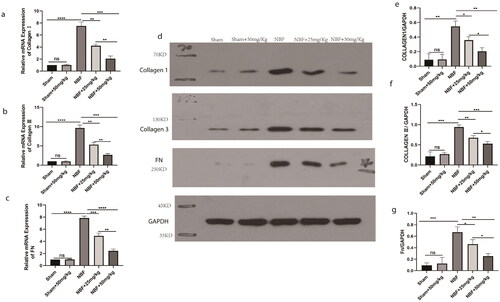
Figure 6. Protein expression of the TGF-β1/αSMA/BCL-XL signaling pathway in the bladder tissues of different groups. (a) Protein expression of TGF-β1, α-SMA, and BCL-xL in the sham, sham + ABT-263 (50 mg/kg), NBF, NBF + ABT-263 (25 mg/kg), and NBF + ABT-263 (50 mg/kg) groups. (b–d) The histogram of ratio statistics of protein expression of TGF-β1, α-SMA, and BCL-xL in bladder tissue shows that the TGF-β1/αSMA/BCL-xL signal pathway expression was normal in the sham and sham + ABT-263 (50 mg/kg) groups, had the highest overexpression in the NBF group, was improved in the NBF + ABT-263 group (25 mg/kg), and greatly improved in the NBF + ABT-263 group (50 mg/kg).ns p > 0.5, *p < 0.01,**p < 0.001, ***p < 0.0001. All experiments were repeated three times.
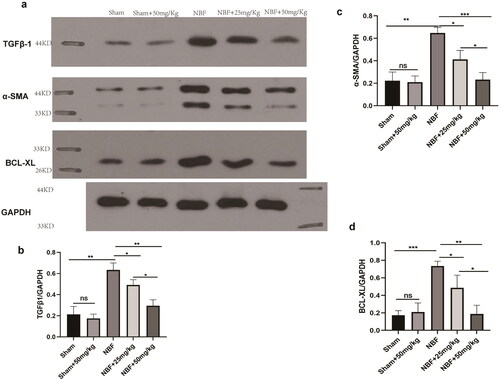
Figure 7. ABT-263 promotes apoptosis of primary bladder fibroblasts through the mitochondrial apoptosis pathway. Histogram of CCK8 statistics in primary bladder fibroblasts under different concentrations of ABT-263, which shows that when the concentration of ABT-263 increased to 10 µmol, cell viability began to deteriorate, and the cell viability rate deteriorated with increasing ABT-263 concentration–g: Changes in α-SMA fluorescence intensity of primary bladder fibroblasts under different concentrations of ABT-263, which shows that when the concentration of ABT-263 increased to 10 µmol, the α-SMA fluorescence intensity began to weaken, and the α-SMA fluorescence intensity decreased with increasing ABT-263 concentration. i–n: Flow cytometric representation of primary bladder fibroblasts treated with different concentrations of ABT-263.h: Histogram of apoptosis statistics of primary bladder fibroblasts under different concentrations of ABT-263 by representative flow cytometry, which shows that when the concentration of ABT-263 increased to 10 µmol, the cells began to undergo apoptosis, and the apoptosis rate increased with increasing ABT-263 concentration: Expression of mitochondrial pathway-related proteins in primary bladder fibroblasts treated with different concentrations of ABT-263.p–r: Histogram of BCL-xL, Cytoc, and cleaved caspase-3 proteins in primary bladder fibroblasts under different concentrations of ABT-263, which shows that when the concentration of ABT-263 increased to 10 µmol, the mitochondrial pathway began to activate, and the degree of activation increased with increasing ABT-263 concentration. Data are expressed as the mean ± SEM; ns p > 0.5, *p < 0.01, **p < 0.001, ***p < 0.0001. All experiments were repeated three times.
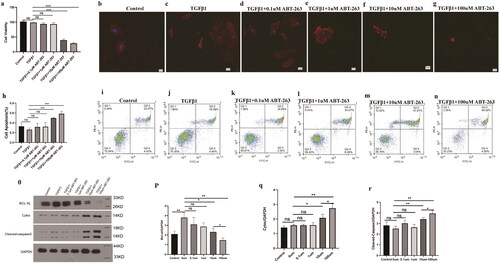
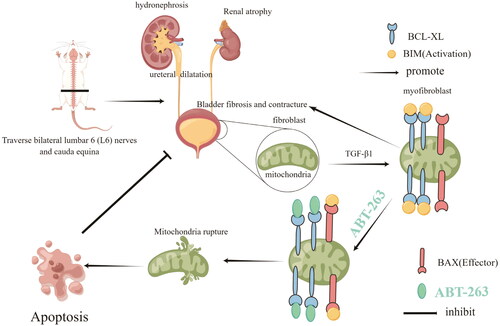
Figure 8. A sketch of the experiment.
Data availability statement
All data generated or analyzed during this study are available from the corresponding author upon reasonable request.