
Figures & data
Figure 1. Effect of Rg1 treatment on fasting blood glucose and renal function indicators in T2DM mice. (A) The levels of fasting blood glucose (FBG, mM). (B) The level of blood urea nitrogen (BUN, mM). (C) The level of serum creatinine (SCR, μM). The data are expressed as the means ± SD, FBG, n = 8–9, BUN and SCR, n = 6. *p< 0.05, **p< 0.01 compared with the control group; ##p< 0.01 compared with the HFD + STZ group.
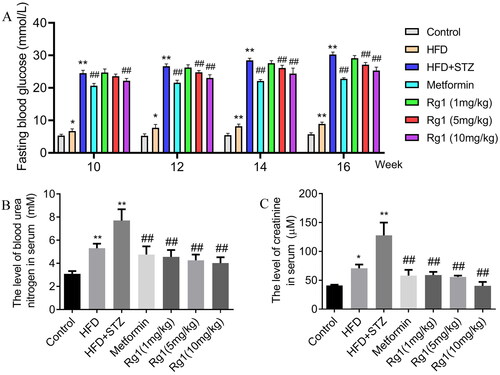
Figure 2. Effect of Rg1 treatment on renal lipid deposition and cellular senescence in T2DM mice. (A) The results of lipid deposition in the renal cortex (Oil Red O staining, ×400). (B) The mean density of Oil Red O staining in the renal cortex. (C) The results of cellular senescence in the renal cortex (β-Gal staining, ×400). (D) The mean density of β-Gal staining in the renal cortex. The data are expressed as the means ± SD, n = 4. **p< 0.01 compared with the control group; ##p< 0.01 compared with the HFD + STZ group.
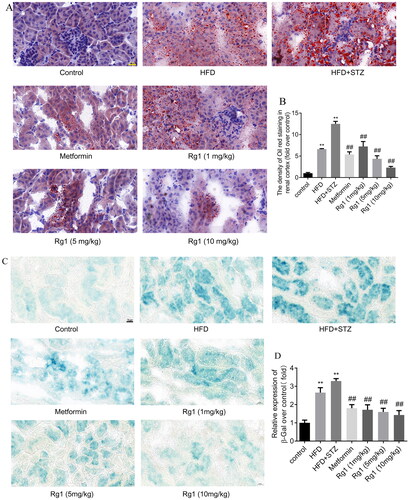
Figure 3. Effect of PA and PA + HG on the fibrosis of HMCs. (A) The result of Col4 expression in the HMCs (immunofluorescence, ×400). (B) The mean density of Col4 fluorescence in the HMCs. (C) The level of Col4 mRNA. (D) The bands of FN, TGF-β, and GAPDH (Western blotting). (E) The relative expression of FN over control. (F) The relative expression of TGF-β over control. (G) The level of FN mRNA (q-PCR). (H) The level of TGF-β mRNA (q-PCR). The data are expressed as the mean ± SD, n = 3, *p< 0.05, **p< 0.01 compared with the control group.
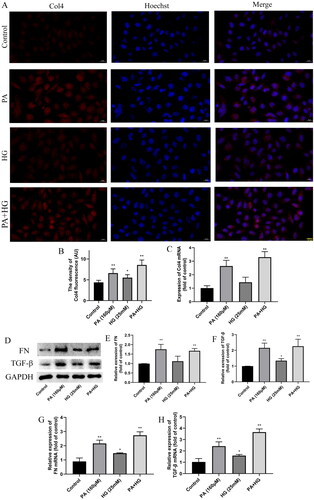
Figure 4. Effect of Rg1 treatment on renal fibrosis in T2DM mice. (A) The results of fibrosis in the renal cortex (Masson staining, ×400). (B) The mean density of Masson staining in the renal cortex. (C) The result of FN expression in the renal cortex (immunofluorescence, ×400). (D) The mean density of FN fluorescence in the renal cortex. The data are expressed as the mean ± SD, Masson, n = 6, FN, n = 4, **p< 0.01 compared with the control group; #p< 0.05, ##p< 0.01 compared with the HFD + STZ group.
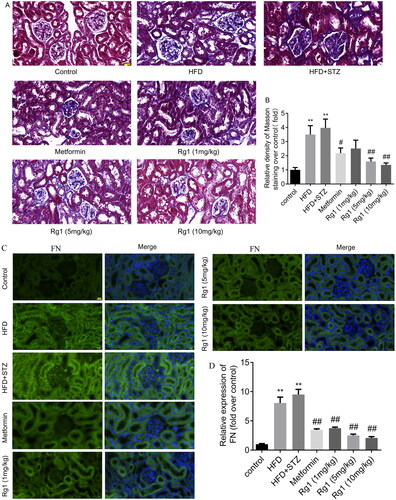
Figure 5. Effect of Rg1 on the expression of TGF-β and Kim-1 in the renal cortex of T2DM mice. (A) The bands of TGF-β (Western blotting). (B) The relative expression of TGF-β over control. (C) The bands of Kim-1 (Western blotting). (B) The relative expression of Kim-1 over control. The data are expressed as the mean ± SD, n = 4, *p< 0.05, **p< 0.01 compared with the control group; #p< 0.05, ##p< 0.01 compared with the HFD + STZ group.
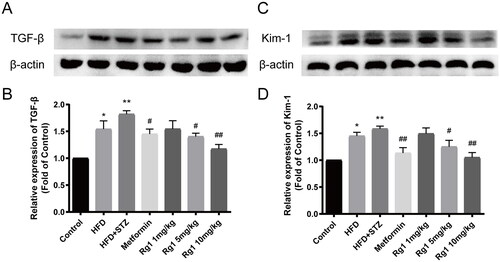
Figure 6. Effects of PA and PA + HG on lipid deposition and oxidative stress in the HMCs. (A) The results of lipid deposition in the HMCs (Oil Red O staining, ×200). (B) The ROS production of HMCs (H2DCFDA, ×200). (C) The mean density of Oil Red O staining in the HMCs. (D) The mean density of ROS production in the HMCs. (E) The bands of p47phox, p22phox, NOX4, and GAPDH (Western blotting). (F) The relative expression of p47phox over control. (G) The relative expression of p22phox over control. (H) The relative expression of NOX4 over control. The data are expressed as the mean ± SD, n = 3, *p< 0.05, **p< 0.01 compared with the control group.
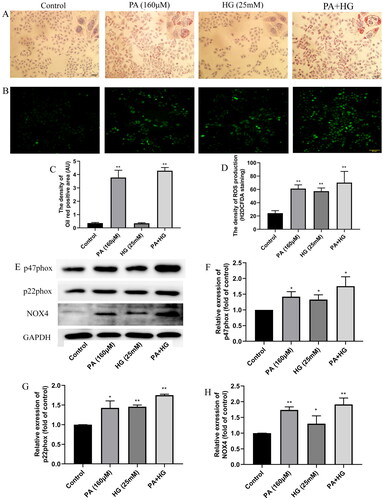
Figure 7. Effect of Rg1 treatment on oxidative stress in the renal cortex of T2DM mice. (A) The results of ROS production in the renal cortex (DHE staining, ×400). (B) The mean density of ROS fluorescence in the renal cortex. (C) The bands of NOX4, p22phox, p47phox, and β-actin (Western blotting). (D) The relative expression of NOX4 over control. (E) The relative expression of p22phox over control. (F) The relative expression of p47phox over control. The data are expressed as the mean ± SD, ROS, n = 3, Western Blot, n = 4, **p< 0.05 compared with the control group; #p< 0.05, ##p< 0.01 compared with the HFD + STZ group.
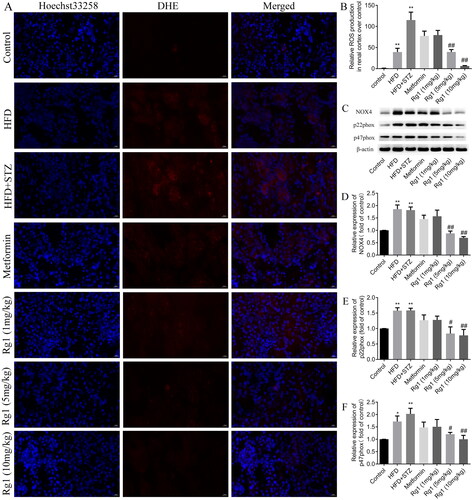
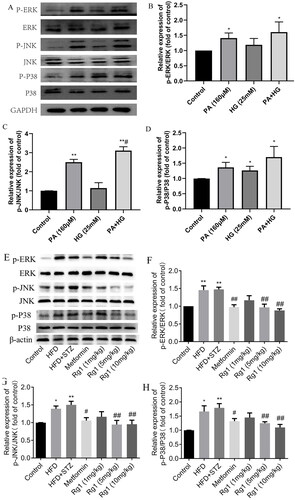
Figure 8. Effects of PA and PA + HG on MAPK pathway in the HMCs and the regulatory role of Rg1 in the T2DM mice. (A) The bands of p-JNK, JNK, p-P38, P38, p-ERK, ERK, and GAPDH in the HMCs (Western blotting, n = 3). (B) The relative expression of p-ERK/ERK in the HMCs over control. (C) The relative expression of p-JNK/JNK in the HMCs over control. (D) The relative expression of p-P38/P38 in the HMCs over control. (E) The bands of p-JNK, JNK, p-P38, P38, p-ERK, ERK, and β-actin in the mice (Western blotting, n = 4). (F) The relative expression of p-ERK/ERK over control. (G) The relative expression of p-JNK/JNK over control. (H) The relative expression of p-P38/P38 over control. The data are expressed as the mean ± SD, *p< 0.05, **p< 0.01 compared with the control group; #p< 0.05, ##p< 0.01 compared with the HFD + STZ group.
Supplemental Material
Download PDF (300.7 KB)Data availability statement
The data supporting this study’s findings are available from the corresponding author upon reasonable request.