Figures & data
Figure 1. Flowchart of patients undergoing the 7-year protocol biopsy.
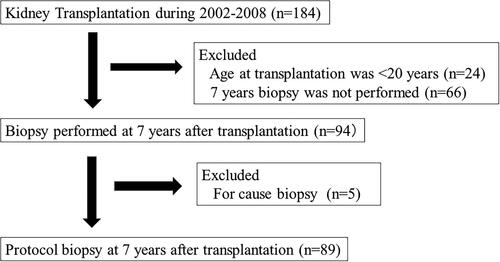
Table 1. Baseline clinical characteristics of patients who underwent 7-year protocol biopsies.
Figure 2. Prevalence of positive Banff scores for the 7-year protocol biopsy.
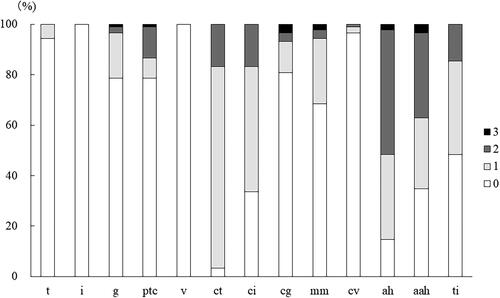
Table 2. Linear univariate regression analysis results for the association between eGFR change per year and each parameter.
Table 3. Linear multivariate regression analysis results for the association between eGFR change per year and each parameter.
Figure 3. Main diagnoses of mm-positive lesions.
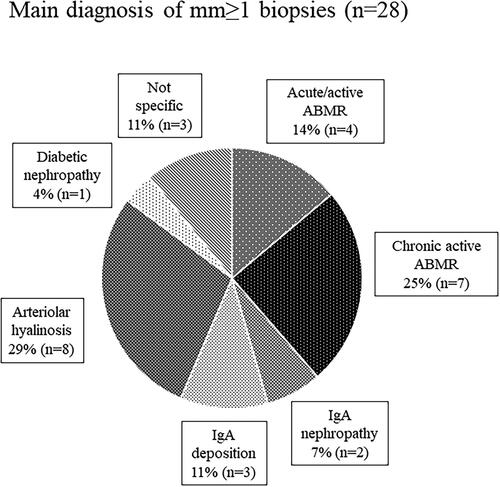
Figure 4. Graft survival between (a) mm < 1 and mm ≥ 1; (b) proteinuria < 1+, proteinuria 1+, and proteinuria ≥ 2+.
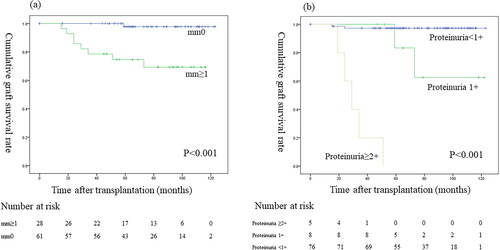
Figure 5. Graft survival between (a) mm ≥ 1 with ABMR and mm ≥ 1 without ABMR; (b) mm ≥ 1 with proteinuria and mm ≥ 1 without proteinuria; (c) proteinuria with mm ≥ 1 and without mm ≥ 1.
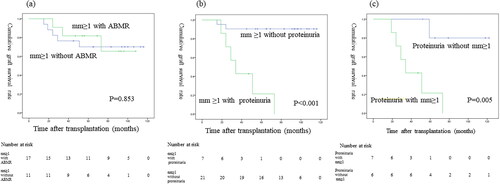
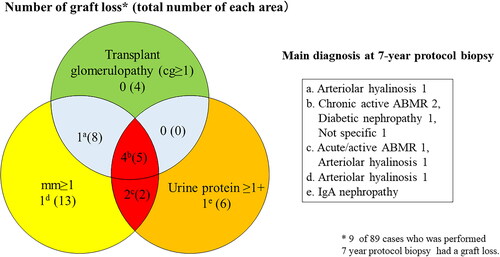
Figure 6. Overlap among graft loss cases with mm ≥ 1, cg ≥ 1, and proteinuria ≥ 1+.