Figures & data
Table 1. Comparison of characteristics between the development cohort and the validation cohort.
Table 2. Characteristics of patients between non-relapse group and relapse group in development group.
Table 3. Univariate and Multivariate Cox regression analysis for predictors of relapse.
Figure 1. Flow diagram of the whole study.
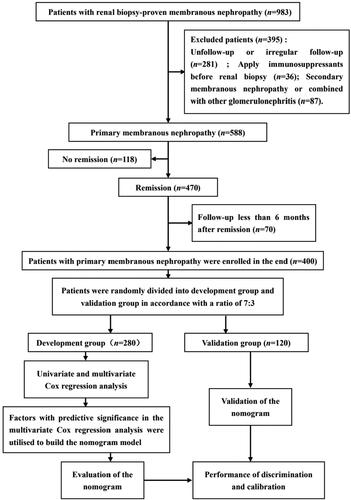
Figure 2. Nomogram for the prediction for IMN reccurence. HUA: Hyperuricemia; CRP: C-reactive protein; CR: complete remisssion.
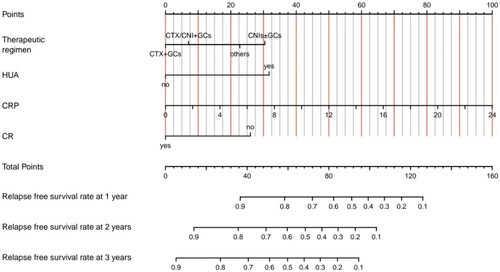
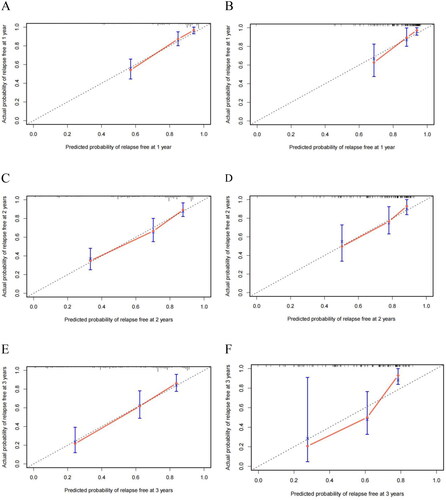
Figure 3. Calibration plots in the development and validation group of the nomogram. Calibration at 1 year in the development group (A) and validation group(B), Calibration at 2 years in the development group (C) and validation group(D), Calibration at 3 years in the development group (E) and validation group (F).