
Figures & data
Figure 1. Enrollment flowchart for this study. HD: hemodialysis.
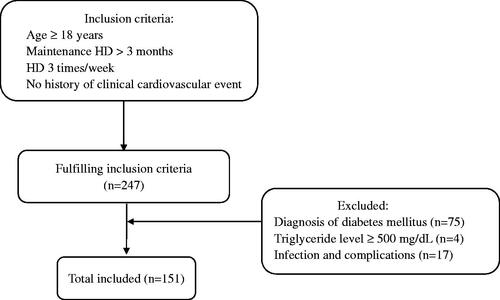
Table 1. Clinical characteristics of the participants according to TyG index tertiles.
Table 2. Correlations between the CACS and risk factors.
Table 3. Poisson regression analysis of CAC with the TyG index.
Figure 2. The CACS was grouped according to the TyG index tertiles. CACS: coronary artery calcification score. *<0.05; **<0.01; ***<0.001.
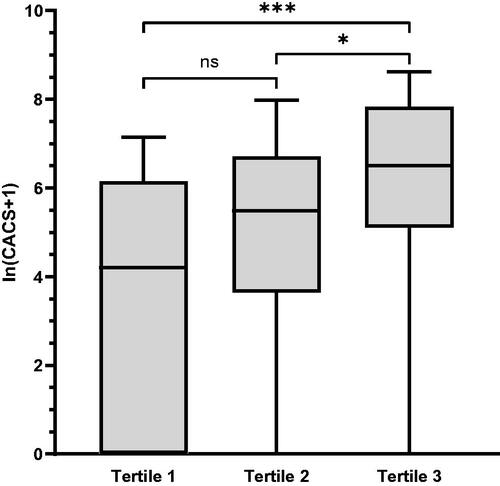
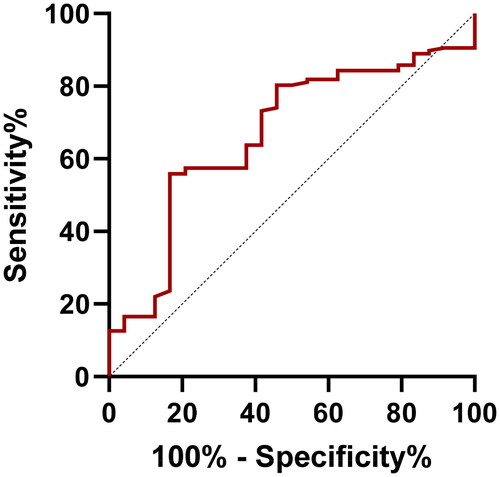
Figure 3. ROC curves of the TyG index (AUC = 0.667). ROC: receiver operating characteristic; AUC: area under the curve.
Data availability statement
The data analyzed in this study are available from the corresponding author upon reasonable request.