
Figures & data
Table 1. Baseline characteristics of patients across Group1/Group2.
Table 2. Regression coefficients of dialysis symptom index scores based on 9 independent variables.
Figure 1. Prevalence of individual symptoms across the overall cohort.
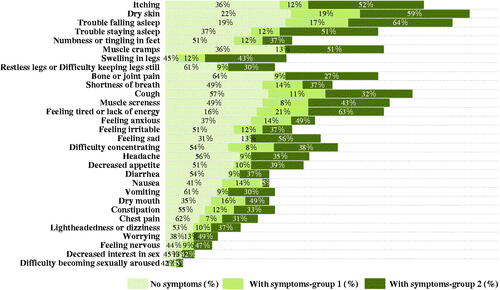
Figure 2. Prevalence of individual symptoms across group 1.
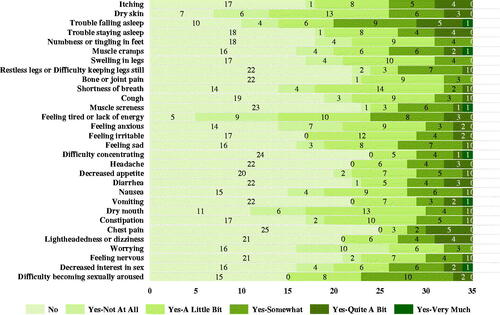
Figure 3. Prevalence of individual symptoms across group 2.
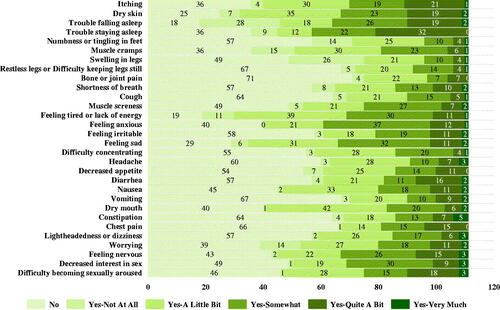
Table 3. Scores of individual symptoms across Group1/Group2.
Figure 4. (Pearson) correlation analysis between individual symptoms.
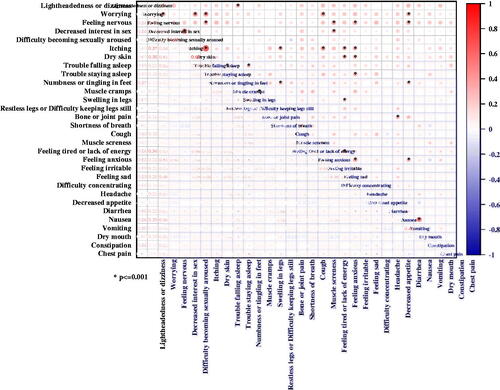
Table 4. Key clinical characteristics across Group1/Group2.
Data availability statment
The data that support the findings of this study are not publicly available due to containing information that could compromise the privacy of research participants. Further inquiries can be directed to the corresponding author.