
Figures & data
Table 1. The detail NOS score of studies included.
Table 2. The basic information table of studies included.
Figure 1. Flowchart of study selection.
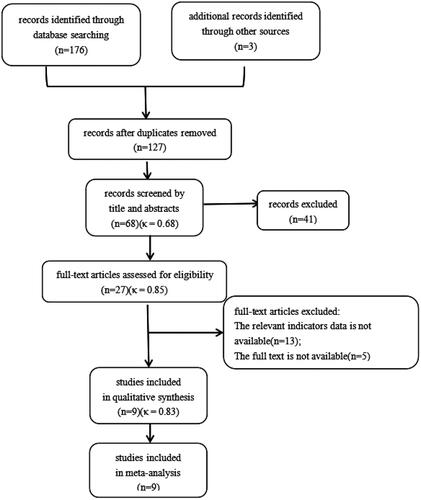
Figure 2. Forest plot of the incidence of acute kidney injury after cardiac surgery and serum ferritin. Forest plot revealing that patients who developed AKI after cardiac surgery had lower baseline serum ferritin levels than those who did not develop AKI (p = 0.010). 95% CI, 95% confidence interval.
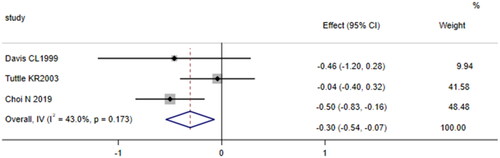
Figure 3. Forest plot of the incidence of acute kidney injury after cardiac surgery and plasma hepcidin. Forest plot indicating no significant difference in plasma hepcidin levels between patients undergoing cardiac surgery who developed AKI and those who did not (p = 0.416; p = 0.539). 95% CI, 95% confidence interval.
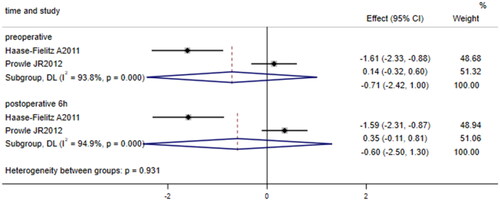
Figure 4. Forest plot of the incidence of acute kidney injury after cardiac surgery and urinary hepcidin. Forest plot showing that after cardiac surgery, the level of 24-h postoperative urinary hepcidin in patients who developed AKI was lower than that in patients who did not develop AKI (p = 0.000); however, preoperative and 6-h postoperative urinary hepcidin levels were not significantly different between patients who developed AKI and those who did not develop AKI (p = 0.254; p = 0.542). 95% CI, 95% confidence interval.
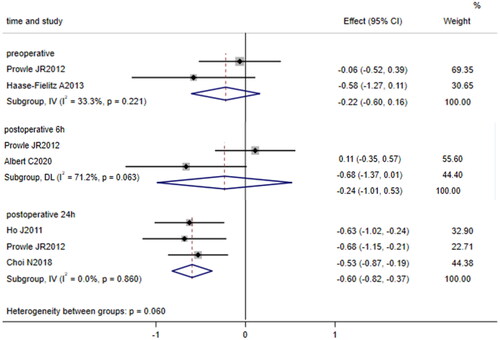
Figure 5. Forest plot of the incidence of acute kidney injury after cardiac surgery and urinary hepcidin/urine creatinine ratio. Forest plot indicating that patients who developed AKI after cardiac surgery had a lower 24-h postoperative urinary hepcidin/urine creatinine ratio than those who did not develop AKI after cardiac surgery (p = 0.000); however, there was no significant difference in the 6-h postoperative urinary hepcidin/urine creatinine ratio between patients who developed AKI and those who did not develop AKI (p = 0.377). 95% CI, 95% confidence interval.
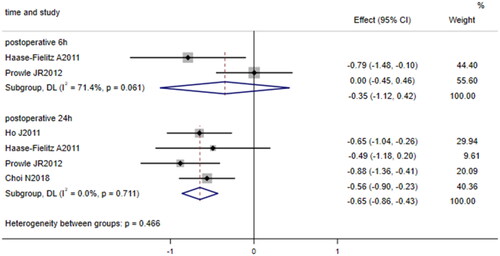
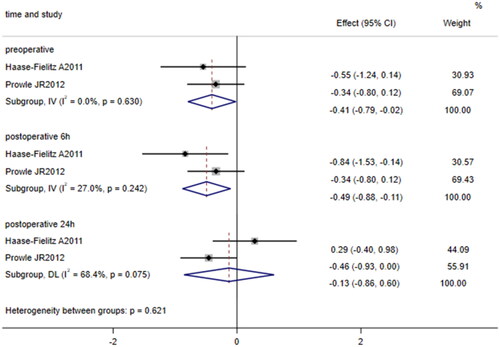
Figure 6. Forest plot of the incidence of acute kidney injury after cardiac surgery and urinary FE of hepcidin. Forest plot displaying that the levels of preoperative and 6-h postoperative urine FE of hepcidin (p = 0.038; p = 0.012) in patients who developed AKI after cardiac surgery were lower than those in patients who did not develop AKI after cardiac surgery; however, there was no significant difference in the levels of 24-h postoperative FE of hepcidin between patients who developed AKI after cardiac surgery and those who did not develop AKI after cardiac surgery (p = 0.726). 95% CI, 95% confidence interval.
Supplemental Material
Download PDF (224.1 KB)Data availability statement
All data analyzed during this study are available in the public domain.