
Figures & data
Table 1. Characteristics of participants with CKD by carbohydrate intake quantiles.
Figure 1. Association between percentage energy intake of macronutrients and all-cause mortality in participants with CKD.
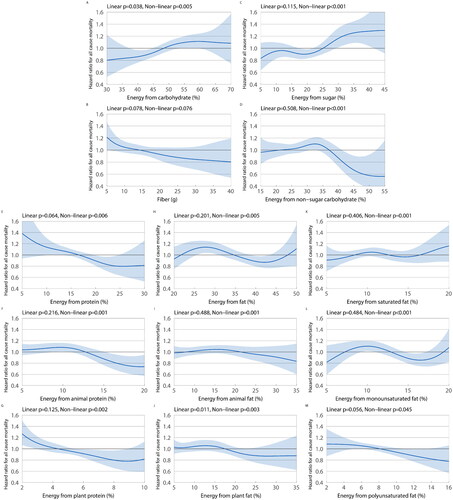
Table 2. Association between low carbohydrate/sugar diet and all-cause mortality by quantiles in participants with CKD.
Figure 2. Association between percentage energy intake of macronutrients and all-cause mortality in participants with CKD subgroups (eGFR <60 mL/min·1.73m2; ACR ≥30 mg/g).
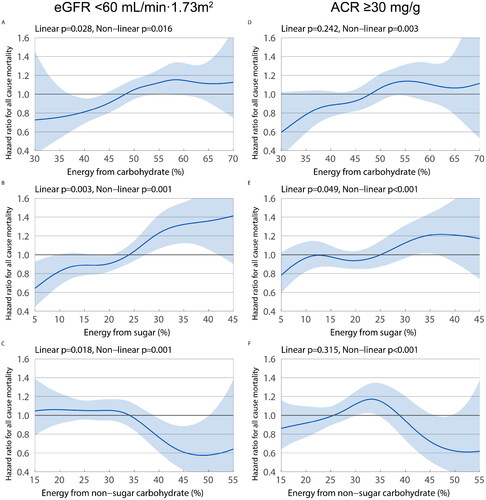
Figure 3. Iso-caloric replacement analysis on replacing carbohydrates with other macronutrients in participants with CKD.
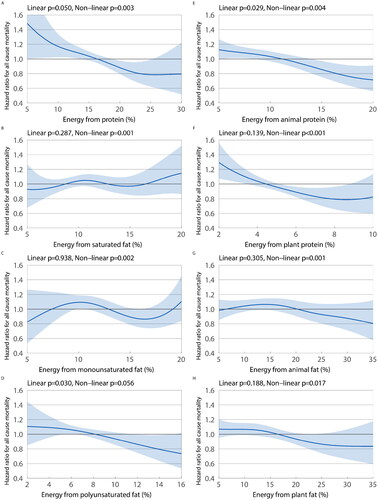
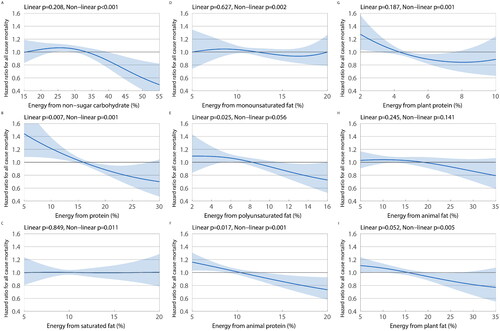
Figure 4. Iso-caloric replacement analysis on replacing sugar with other macronutrients in participants with CKD.
Supplemental Material
Download PDF (612.9 KB)Availability of data and materials
The datasets analyzed during the current study are available at [https://wwwn.cdc.gov/nchs/nhanes/Default.aspx].