
Figures & data
Figure 1. Flowchart for the selection of the study population, NHANES (2007–2018). A total of 6401 participants for VCEAC cohort and 6379 for CDAI cohort were separately eligible for criteria. After the exclusion of those pregnant or lactating women, and those with TAC values more than five standard deviations from the mean, 6330 participants with CKD were included in the final VECAC cohort analysis and 6300 participants with CKD were included in the final CDAI cohort analysis.
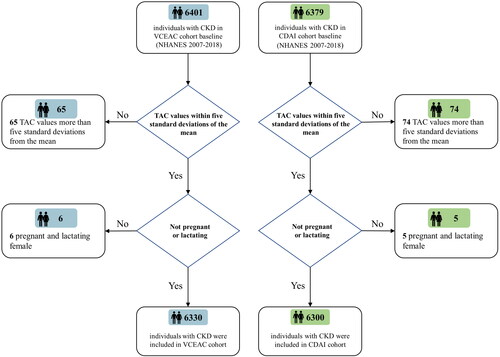
Figure 2. Restricted cubic spline models for the relationship between dietary total antioxidant capacity with all-cause (top) and CVD (bottom) mortality. (A) CKD 1–2 stage, VCEAC and all-cause mortality. (B) CKD 3–5 stage, VCEAC and all-cause mortality (C) CKD 1–2 stage, CDAI and all-cause mortality. (D) CKD 3–5 stage, CDAI and all-cause mortality (E) CKD 1–2 stage, VCEAC and CVD mortality. (F) CKD 3–5 stage, VCEAC and CVD mortality. (G) CKD 1–2 stage, CDAI and CVD mortality. (H) CKD 3–5 stage, CDAI and CVD mortality. Adjusted for age, sex, ethnicity, income, education level, potassium intake, protein intake, carbohydrate intake, dietary fiber intake, total fat intake, alcohol intake, total energy intake via the residual method, smoking, MET-PA, diabetes, hypertension, CVD and cancer, urine albumin, eGFR, and BMI. The first quartile of VCEAC/CDAI was used as reference as it yields a hazard ratio of 0. The first and last knots were placed at the 0.01 quantile and 0.99 quantile of DTAC. Shading indicates the 95% confidence interval.
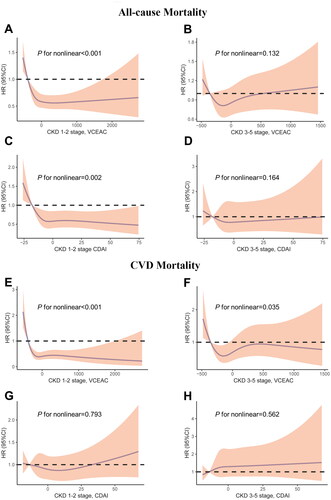
Table 1. Association of VCEAC and CDAI with all-cause mortality among patients with CKD in the NHANES (2007–2018).
Table 2. Association of VECAC and CDAI with CVD mortality among patients with CKD in the NHANES (2007–2018).
Figure 3. Subgroup analyses of multi-variable adjusted association of VCEAC or CDAI with all-cause (top) and CVD (bottom) mortality in the NHANES (2007–2018), stratified by selected patients’ characteristics. (A) VCEAC and CDAI with all-cause mortality. (B) VCEAC and CDAI with CVD mortality. Abbreviations: HRs: hazard ratios; CI: confidence intervals; CVD: cardiovascular disease; CDAI: Component Dietary Antioxidant Index; VCEAC: Vitamin C Equivalent Antioxidant Capacity. Adjusted for ethnicity, income, and education level, smoking status, potassium intake, protein intake, alcohol intake, total dietary fat intake, carbohydrate intake, and total energy intake was adjusted via the residual method, BMI, MET-PA, with exception of stratifying factors.
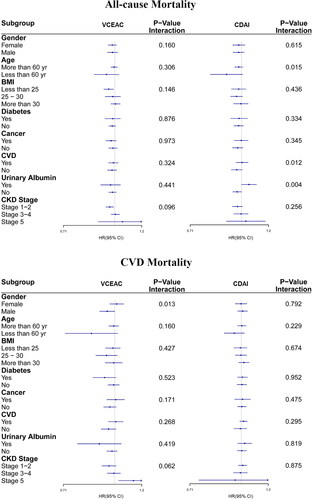
Table 3. Mediation analysis of VCEAC with mortality of CKD.
Table 4. Mediation analysis of CDAI with mortality of CKD.
Supplemental Material
Download PDF (394.9 KB)Data availability statement
The data that support the findings of this study are openly available in NHANES at http://www.cdc.gov/nhanes. Additional data are available from the corresponding author on reasonable request.