
Figures & data
Figure 1. Renal biopsy specimen with acute and chronic tubulointerstitial lesions. (1) shows an acute tubulointerstitial lesion, where a indicates tubular epithelial edema and b indicates tubular epithelial necrosis; (2) shows a chronic tubulointerstitial lesion, where c indicates interstitial fibrosis. (1) and (2) are both Periodic acid Schiff (PAS) staining ×400.
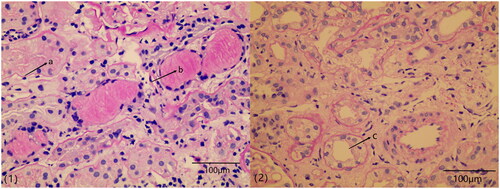
Table 1. Comparison of basic clinical features and laboratory tests between the two groups.
Figure 2. The correlation between Ehrenreich–Chrug scores and tubulointerstitial lesion score. Scatter plot in Spearman correlation analysis shows the correlation between the Ehrenreich–Chrug score and interstitial lesion score.
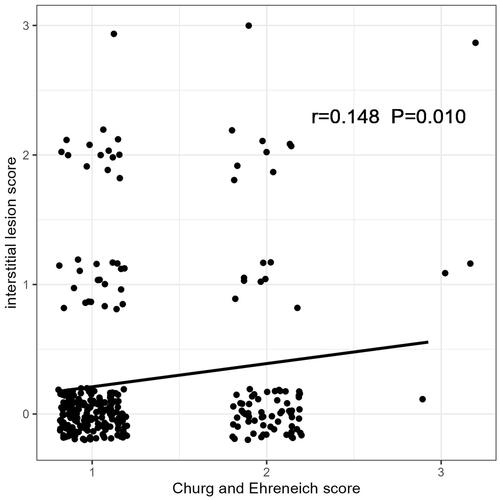
Table 2. Histopathological parameters of kidney biopsy.
Table 3. Comparison of remission rate between two groups after treatment.
Table 4. Laboratory parameters of IMN patients after treatment.
Figure 3. TID can predict kidney outcome in patients with IMN. See methods for the definition of worsening kidney condition. Kidney survival is depicted for patients with TID (TID+, red line, N = 54) and without TID (TID−, blue line, N = 246).
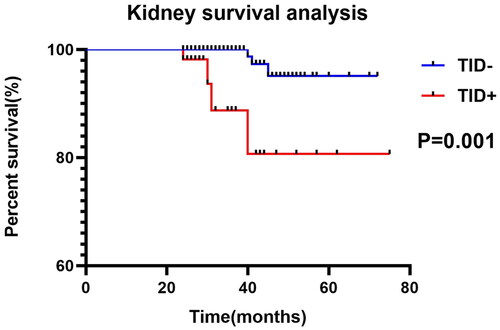
Table 5. The adverse reaction of the two groups was compared.
Table 6. Univariate Cox regression analysis of kidney function deterioration in IMN patients.
Table 7. Multivariate Cox regression analysis of kidney function deterioration in IMN patients.
Data availability statement
The data that support the findings of this study are available from the corresponding author upon reasonable request.